John Salter’s Blog
Follow my ruminations
Get new content delivered directly to your inbox.
- “Missed it by that much” …
is an old joke from the TV series ‘Get Smart”
https://youtube.com/shorts/PmMjifK0L5A?is=tO52zmmDYGT3cxcVThis week I missed a connecting flight in Frankfurt. Having come from Australia I needed to clear the new border entry requirements.

I appreciate the strategy of needing to check at the first point of entry.
I did not appreciate how poorly the integration of this requirement was being implemented in airport systems.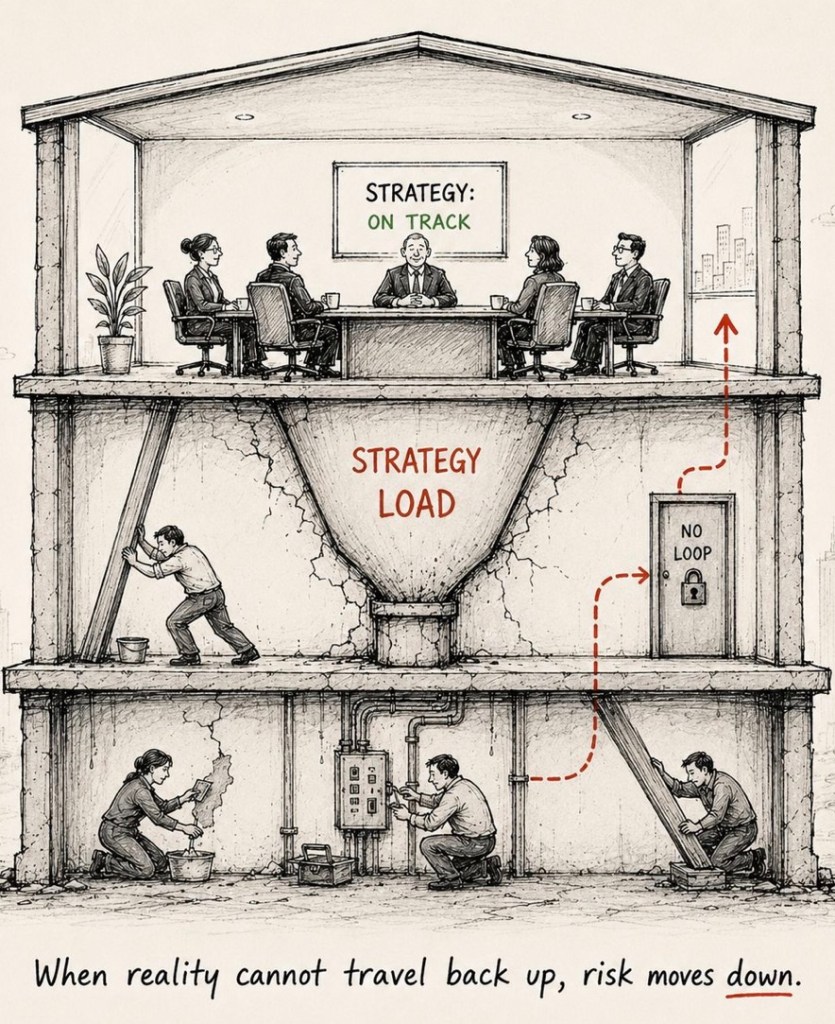
The failure to have adequately premised this fundamental “what if” is fairly widespread in scope, because the new EU Entry/Exit System now applies across the 29-country Schengen area, but the actual disruption is uneven rather than universal at every airport all day. The biggest problems have been reported at external-border passport control points during peak waves of arrivals, where airports and airlines have recorded missed flights and typical waits of 2–3 hours, with some cases even longer.[2][4][5]Where it is happening
Airports Council International Europe said data from airports in 15 countries showed border-control waiting times had “significantly increased” after full operation began. Reported trouble spots have included airports in France, Germany, Belgium, Italy, Spain, and Greece, while other reporting also highlighted major issues in Spain, Portugal, France, and Italy.[7][1]
How uneven it is
This is not a case of every passenger everywhere facing the same delay: the European Commission said the system was working “very well” in most countries and that the average registration took just over a minute, though it acknowledged technical issues in a few countries. Separate reporting also noted that some travelers clear controls quickly in quieter periods, while queues spike when several flights arrive close together or equipment and staffing fall short.[8][1]
What it means for connections
The risk is highest for passengers who must clear Schengen external-border control during a connection, because that is where the biometric registration happens for eligible non-EU travelers. Industry groups have warned that these checks have already increased processing times by several multiples and, during peaks, created enough delay for passengers to miss onward flights.[4][5]
How long this may last
There is some built-in flexibility while authorities stabilize the rollout: under the current rules, certain border points can temporarily suspend biometric collection in exceptional circumstances when queues become excessive, with this flexibility available through July and, under conditions, likely into September. That suggests the bottleneck is likely to remain a recurring issue through the busy summer period, but probably as a patchy, airport-by-airport problem rather than a constant continent-wide shutdown.[1]
I should have done my homework and been better prepared (a one hour and 48 minute layover was inadequate) – so revisiting your upcoming schedule might be worth considering.
Sources
[1] Travelers Flying to Europe Face Long Lines Due to New Immigration … https://www.businessinsider.com/europe-travel-airport-lines-immigration-passport-control-border-checks-2026-4
[2] ‘A systemic failure’: How the new Entry/Exit System (EES) … https://www.euronews.com/travel/2026/04/14/a-systemic-failure-how-the-new-entryexit-system-ees-brought-chaos-to-eu-border-control
[3] Entry/Exit System (EES) is fully operational https://home-affairs.ec.europa.eu/news/entryexit-system-ees-fully-operational-2026-04-10_en
[4] EES: The new European border Entry/Exit System goes live on 10 … https://www.diplomatie.gouv.fr/en/presse-et-ressources/decouvrir-et-informer/actualites/ees-le-nouveau-systeme-europeen-de-gestion-des-frontieres-entre-en-service-le-10-avril-2026
[5] Entry Exit System disruptions on first day of full operations … https://www.aci-europe.org/media-room/590-entry-exit-system-disruptions-on-first-day-of-full-operations-affirm-yet-again-the-immediate-need-for-flexibility.html
[6] Travel industry fears summer disruption amid new biometric checks at European borders https://www.theguardian.com/world/2026/feb/05/travel-industry-fears-summer-disruption-biometric-checks-controls-ees-european-borders
[7] New EU entry-exit system causing up to three-hour delays, say airports https://www.theguardian.com/world/2026/apr/15/eu-entry-exit-system-ees-delays-airports-border-checks
[8] Warning of long airport queues under new EU border control system https://www.bbc.com/news/articles/cn0k699pxwzo
[9] EES checks paused? EU responds over … – Connexion France https://www.connexionfrance.com/news/ees-checks-paused-european-commission-responds-to-media-reports/789666
[10] New airport ESS border check delays and how to avoid them – BBC https://www.bbc.com/news/articles/c5yvv7jjny4o
[11] New European border rules have caused delays at airports across … https://www.facebook.com/bbcmanchester/posts/new-european-border-rules-have-caused-delays-at-airports-across-the-continent-af/1387431516752858/
[12] New border rules could mean longer airport queues – LARA https://www.laranews.net/new-border-rules-could-mean-longer-airport-queues/
[13] Passenger misses flight after 3 hour queue caused by new EU entry … https://www.youtube.com/watch?v=C_dQsW6sv8s
[14] Travel Disrupted By New EU Border Control System – Aviation Week https://aviationweek.com/air-transport/airports-networks/travel-disrupted-new-eu-border-control-system
[15] Travellers Told to Expect Long Delays Ahead of New EU Entry Rules https://www.businesstraveller.com/news/travellers-told-to-expect-long-delays-ahead-of-new-eu-entry-rules/
[16] Long queues have built up at some airports around Europe as the … https://www.facebook.com/Channel4News/videos/long-queues-have-built-up-at-some-airports-around-europe-as-the-eus-new-digital-/1298777608889495/
[17] The system has resulted in long waits at EU borders, which has … https://www.facebook.com/ManchesterEveningNews/posts/%EF%B8%8F-the-system-has-resulted-in-long-waits-at-eu-borders-which-has-even-caused-some/1449018343927193/
[18] ‘Chaos’: German opposition slams EU’s new entry-exit system at … https://www.aa.com.tr/en/europe/chaos-german-opposition-slams-eu-s-new-entry-exit-system-at-borders/3917001
[19] EasyJet passengers describe new EU border controls ‘nightmare’ https://www.reddit.com/r/worldnews/comments/1skfqfh/easyjet_passengers_describe_new_eu_border/
[20] EU postpones full EES until September 2026 – Tragento https://tragento.com/en/the-eu-postpones-the-full-ees-until-September-2026–the-goal-is-to-avoid-summer-congestion-at-the-borders/
[21] Italy to Suspend Biometric Border Checks at Busy Airports, Reverts … https://www.visahq.com/news/2026-05-05/it/italy-to-suspend-biometric-border-checks-at-busy-airports-reverts-to-passport-stamps-until-30-september/
[22] The Entry/Exit System will become fully operational on 10 April 2026 https://home-affairs.ec.europa.eu/news/entryexit-system-will-become-fully-operational-10-april-2026-2026-03-30_en
[23] RYANAIR CALLS ON FRENCH GOVT TO SUSPEND EES UNTIL … https://corporate.ryanair.com/news/ryanair-calls-on-french-govt-to-suspend-ees-until-sept-to-prevent-passengers-families-suffering-long-passport-control-queues-this-summer/
[24] EES: The new European border Entry/Exit System goes live on 10 … https://www.diplomatie.gouv.fr/en/services-to-foreigners/visiting-france/ees-the-new-european-border-entryexit-system-goes-live-on-10-april-2026
[25] The European Union has postponed the rollout of its Entry/Exit … https://www.instagram.com/p/DVJyK5GAV9l/
[26] Airports and airlines call for immediate Schengen Entry/Exit … https://www.aci-europe.org/press-release/582-airports-and-airlines-call-for-immediate-schengen-entry-exit-system-ees-review-ahead-of-peak-summer-months-traffic.html
[27] Europe’s Digital Border Entry and ETIAS Launching in 2026 – AFAR https://www.afar.com/magazine/europes-etias-travel-entry-requirement-delayed-until-2026
[28] New EU entry rules and safety warnings for 2026 travel – Facebook https://www.facebook.com/groups/727019224852007/posts/1936630327224218/The new strategy (the EU Entry/Exit System and related border-police procedures) came in the way it did mainly because political and security pressures to “modernise” and digitise borders outweighed the practical preparation needed in airports, IT systems, and staffing.[1][2]
What the EU was trying to do
The Entry/Exit System is a long‑planned project to replace manual passport stamps with a shared EU database containing biometric data (fingerprints and facial images) and entry/exit records for all non‑EU nationals. EU institutions sold it as the “digital backbone” of a new migration and security framework: a way to track overstayers, combat identity fraud, and harmonise fragmented national border records.[2]
Why preparation lagged behind
Although the idea dates back years, the project suffered repeated delays due to technical and budget issues, leaving a compressed window to get infrastructure, training, and staffing ready before the final legal “go live” date. Analysts and lobby groups note that, by launch, many border posts still had understaffed control booths, incomplete or poorly tested equipment, and unclear procedures for handling people already in the database.[1][2]
Warnings that were not fully heeded
Airport and airline associations had warned for months that the new checks, if introduced without extra staff and real stress‑testing at busy hubs, would inevitably create bottlenecks and missed connections. Reporting after rollout quotes industry voices saying EU decision‑makers underestimated operational realities and pushed ahead despite these warnings, leading to gridlock that was “predictable” from an airport-operations point of view.[2][1]
Politics versus practicality
Commentary from both media and policy analysts suggests there was strong political desire to show visible progress on “stronger borders” and migration control after years of debate. That made it harder to delay again, even though many practical pieces (hardware reliability, phased passenger trials, and common fallback procedures) were not fully in place, so the system arrived more on political schedule than on operational readiness.[1][2]
Structural design choices that made it rough
The EU chose a relatively short transition period where old manual passport stamping coexists with the new biometric system, which experts say is “a recipe for confusion and delay” because it doubles complexity at the frontier. Responsibility is also split between Brussels (which builds the rules and central system) and member states (which must staff and equip the actual border posts), so any weak link in that chain shows up as queues for passengers.[2][1]
If you’re mainly worried about your own trips, do you mostly connect through big hubs like Paris/Frankfurt/Amsterdam, or are your connections usually within Italy and other Schengen countries only?
Sources
[1] EUROPE’S BORDER TEST FALTERS! New Digital Checks Triggers Airport Gridlock | Times Now World https://www.youtube.com/watch?v=7CEopNG_LkY
[2] Europe’s new border control system faces early turbulence https://eualive.net/europes-new-border-control-system-faces-early-turbulence/
[3] Europe’s Border Test Backfires, Airports Struggle With New Digital Controls | Watch https://www.youtube.com/watch?v=cLrAiP-AmUw
[4] [PDF] Challenges for Integrated Border Management in the European Union https://www.dcaf.ch/sites/default/files/publications/documents/OP17_Marenin.pdf
[5] [PDF] Restoring the Borderless Schengen Area: Mission Impossible? https://sieps.se/media/4ylfst2h/2024_12epa.pdf
[6] Frontex – Wikipedia https://en.wikipedia.org/wiki/Frontex
[7] Border controls and pushbacks as the new normal? The … https://www.aisdue.eu/wp-content/uploads/2025/01/Post-Anna-Kompatscher.pdf
[8] NEW_DOKLAD.indd https://csd.eu/fileadmin/user_upload/publications_library/files/2011/2011_04_ENG_Better_Management_of_EU_Borders.pdf
[9] Frontex Failing to Protect People at EU Borders – Human Rights Watch https://www.hrw.org/news/2021/06/23/frontex-failing-protect-people-eu-borders
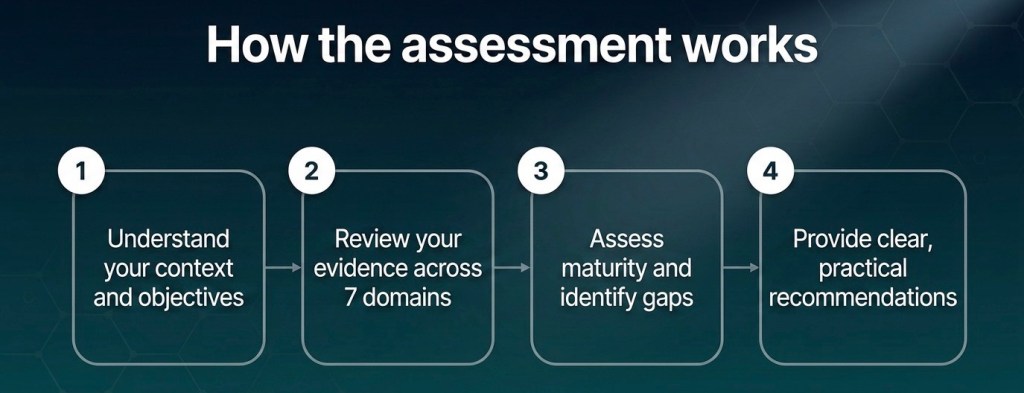
[10] Microsoft Word – EUborderpolice3.doc https://www.statewatch.org/media/1101/cover-up-proposed-regulation-on-european-border-guard-hides-unaccountable.pdf - Capability Assessment Method – Overview
Purpose
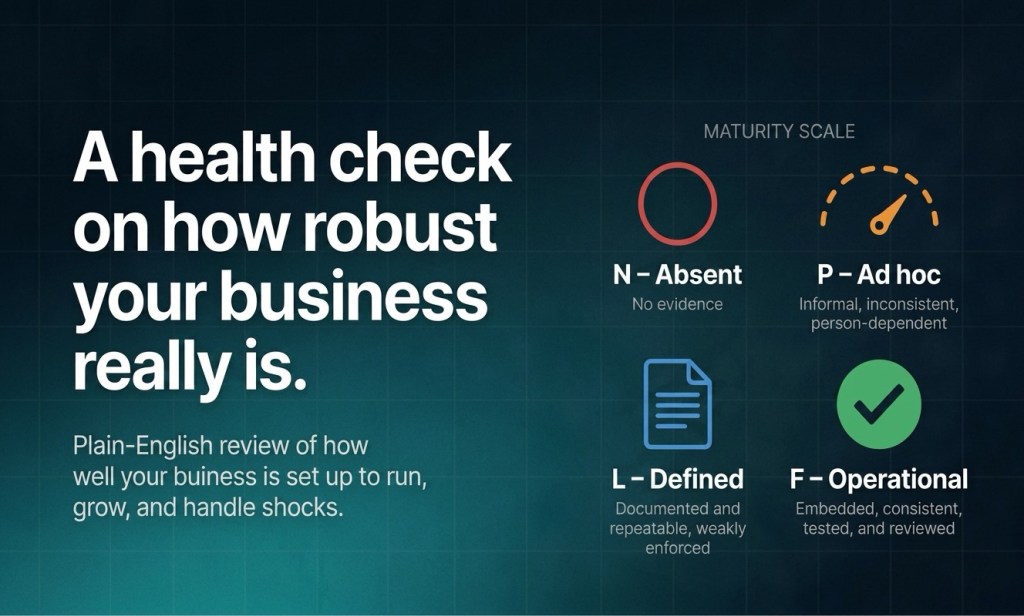
This assessment provides a concise, evidence‑based view of how well the organisation is set up to run, grow, and handle shocks, not just how much documentation it has. It combines a practical business lens with proven public‑sector and private‑sector capability models.
Framework structure
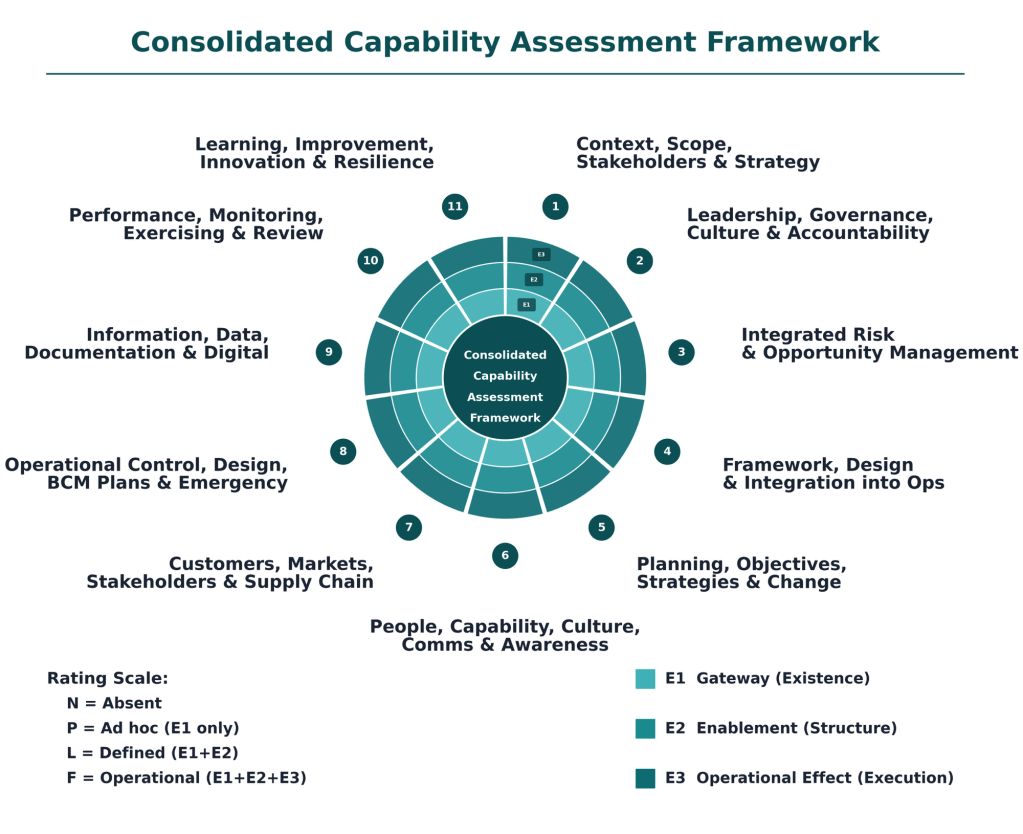
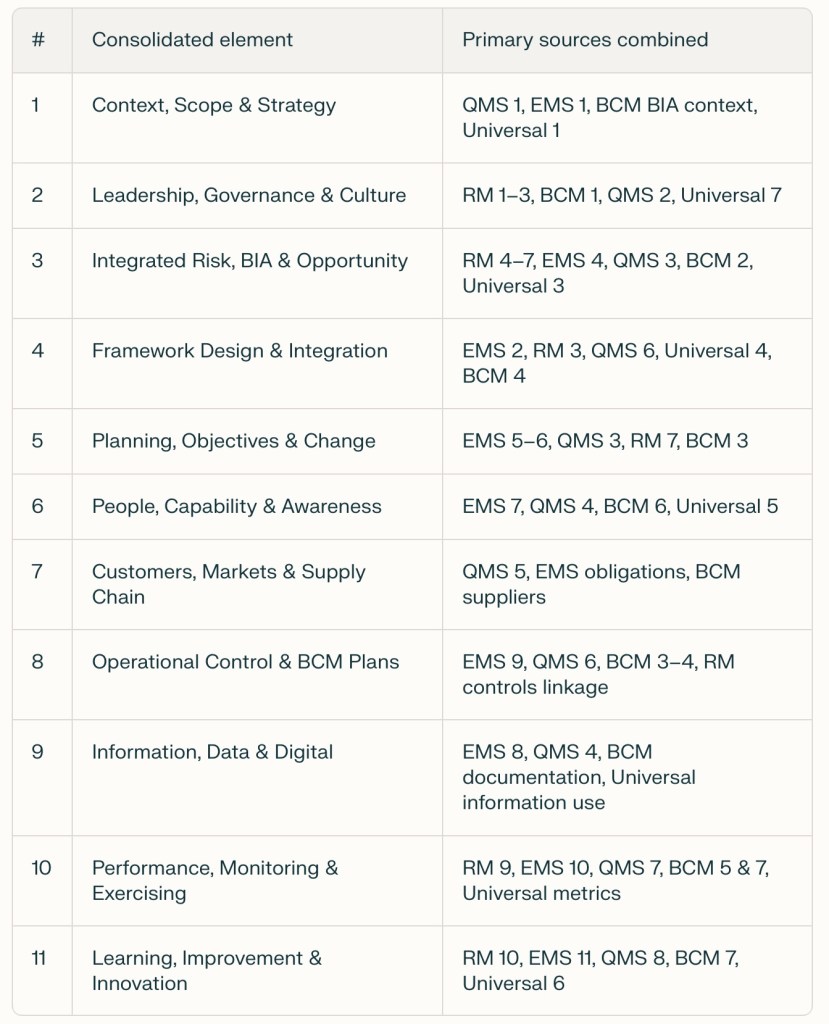
The method assesses capability across 11 domains that together describe how the business works:
- Context, Scope, Stakeholders & Strategy
- Leadership, Governance, Culture & Accountability
- Integrated Risk & Opportunity Management
- Framework, Design & Integration into Operations
- Planning, Objectives, Strategies & Change
- People, Capability, Culture, Communication & Awareness
- Customers, Markets, Stakeholders & Supply Chain
- Operational Control, Design, BCM Plans & Emergency Response
- Information, Data, Documentation & Digital
- Performance Measurement, Monitoring, Exercising & Review
- Learning, Improvement, Innovation & Resilience Evolution
Each domain is assessed using evidence questions tailored to the organisation’s size, context, and sector.
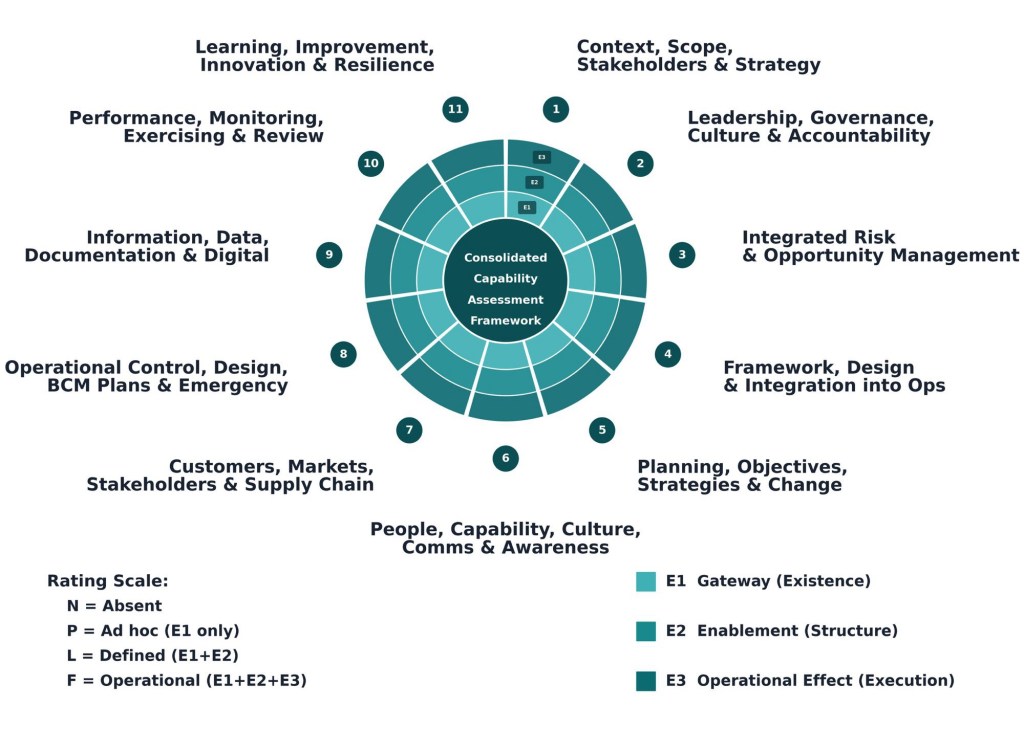
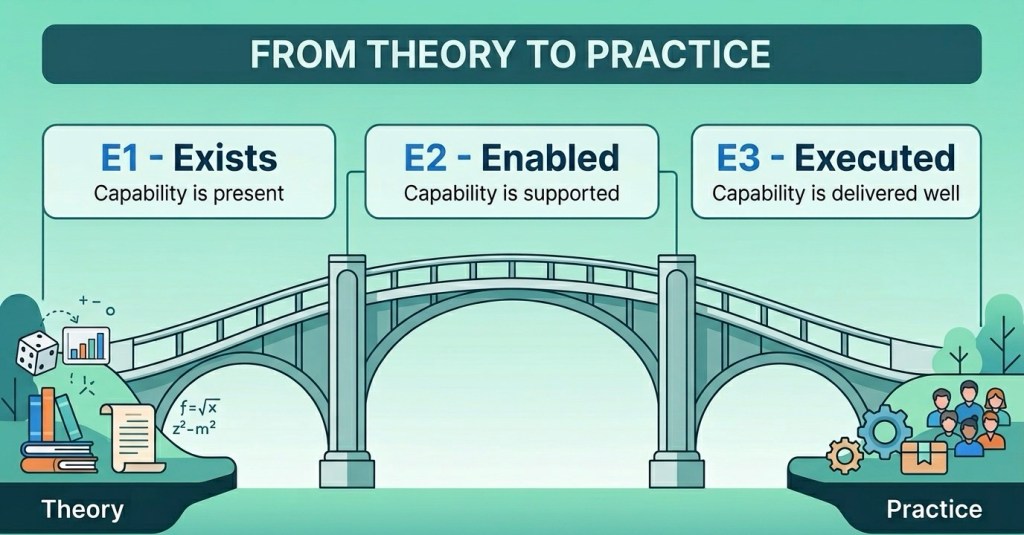
Three evidence tests (E1–E3)
For each domain we look for three levels of evidence:
- E1 – Exists
Do the core structures and processes exist?
(Policies, frameworks, processes, roles, plans, registers, documented approaches.) - E2 – Enabled
Are they supported and usable?
(Clear owners, resources, training, tools, data, and regular review cycles.) - E3 – Executed
Are they actually used and making a difference?
(Real examples where they shape decisions, behaviours, investments, and outcomes.)
In practical terms, E1/E2 tell you “have we built the system?” and E3 asks “does the system change what happens?”
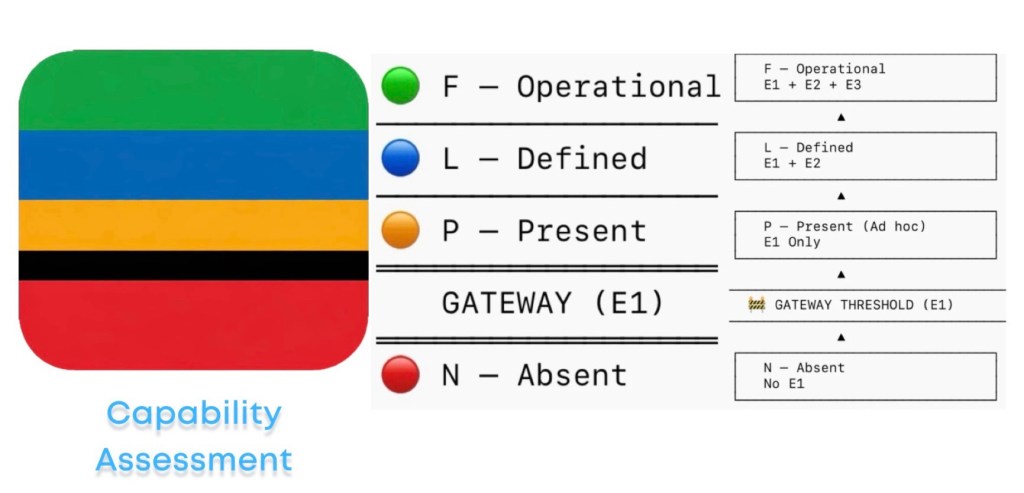
Maturity scale (N–P–L–F)
Evidence across E1–E3 is then converted into a four‑step maturity rating for each domain:
- N – Absent
No meaningful evidence; capability does not meet current needs. - P – Ad hoc
Informal, person‑dependent, inconsistent; pockets of good practice but not reliable. - L – Defined
Documented and repeatable, but weakly enforced; often strong on design, weaker on routine use. - F – Operational
Embedded, consistent, tested, and reviewed; good evidence that it works in practice.
The assessment also considers how well each domain is positioned for future challenges, using concepts like Emerging, Developing, Embedded, and Leading as narrative descriptors, but N/P/L/F remains the formal rating scale.
Outputs
A typical assessment delivers:
- Overall maturity position (e.g. percentage at Defined vs Operational).
- Domain‑by‑domain ratings and commentary, highlighting strengths, gaps, and underlying evidence.
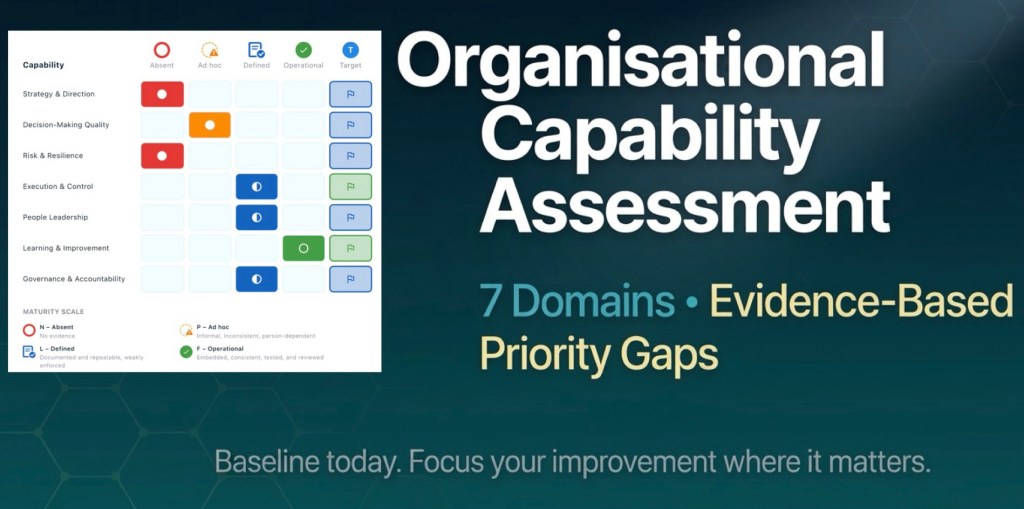
- A simple heat‑map or scorecard showing current and target maturity across the 11 domains.
- A short list of priority gaps and practical actions, sequenced so effort is focused where it matters most.
- Which risk metrics matter most?
In short – the ones that “mean more”

Metric: % of critical risks with treatments that reduce risk to target
Used in our Universal Framework, this is “necessary but not sufficient”.
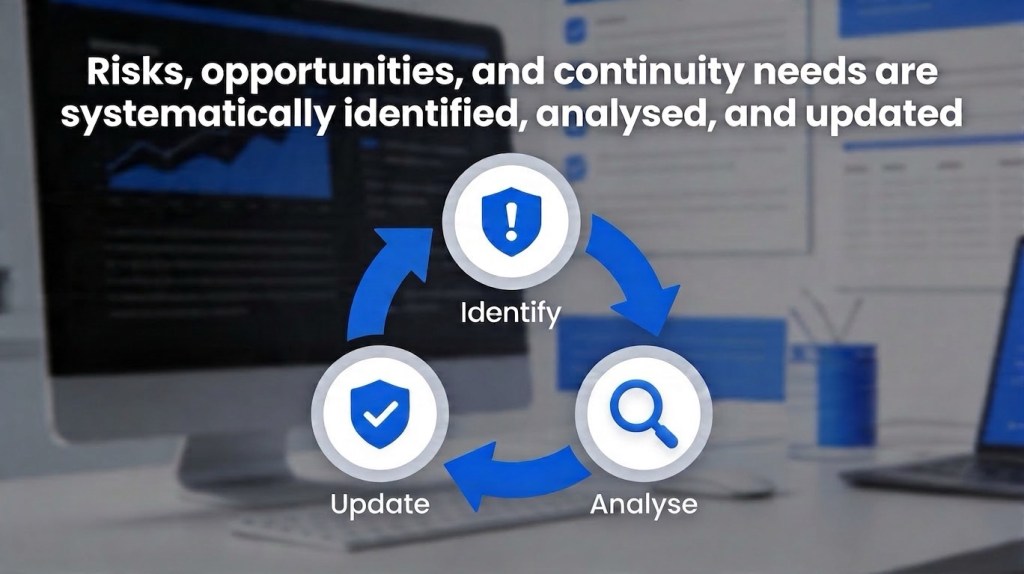
Risks, opportunities, and continuity needs are systematically identified, analysed, and updated. This is a fundamental domain in our Consolidated Framework.
Indeed, we only analyse risk in order to manage them.
But again, not sufficient.
Risk‑based objectives, plans, and continuity strategies guide and control material change. This fundamental domain (in our Consolidated Framework) completes the “necessary and sufficient to be adequate” requirement.
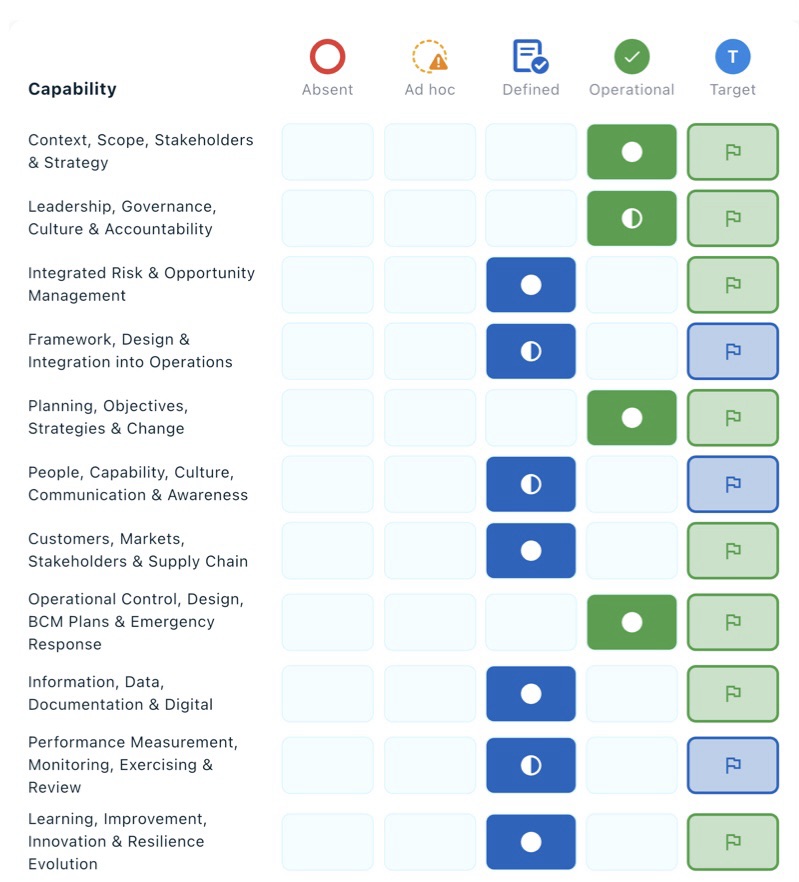
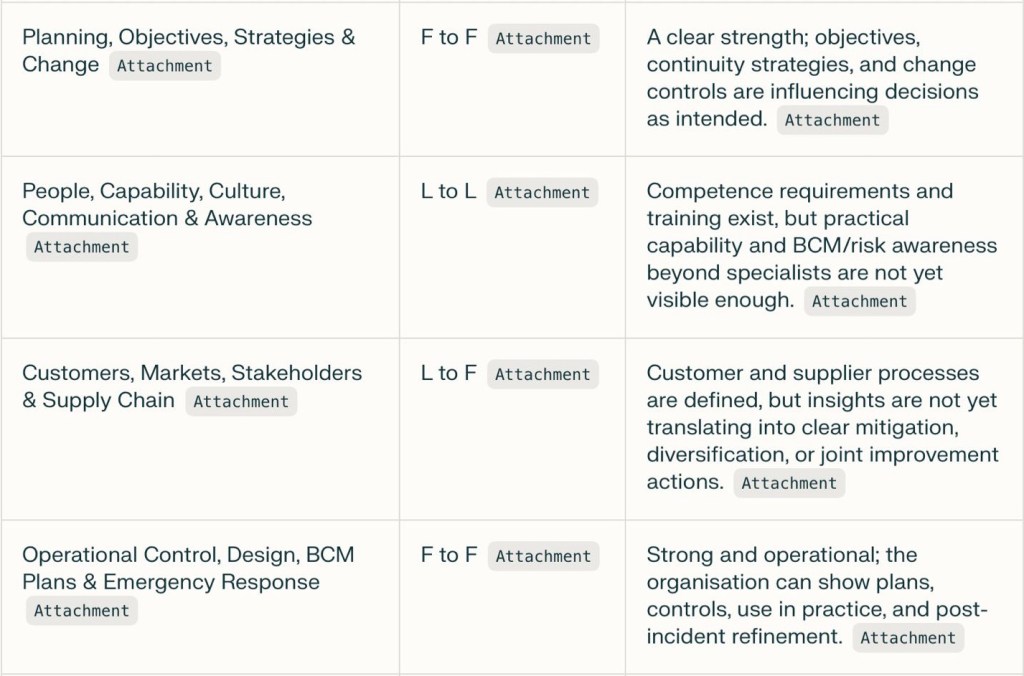
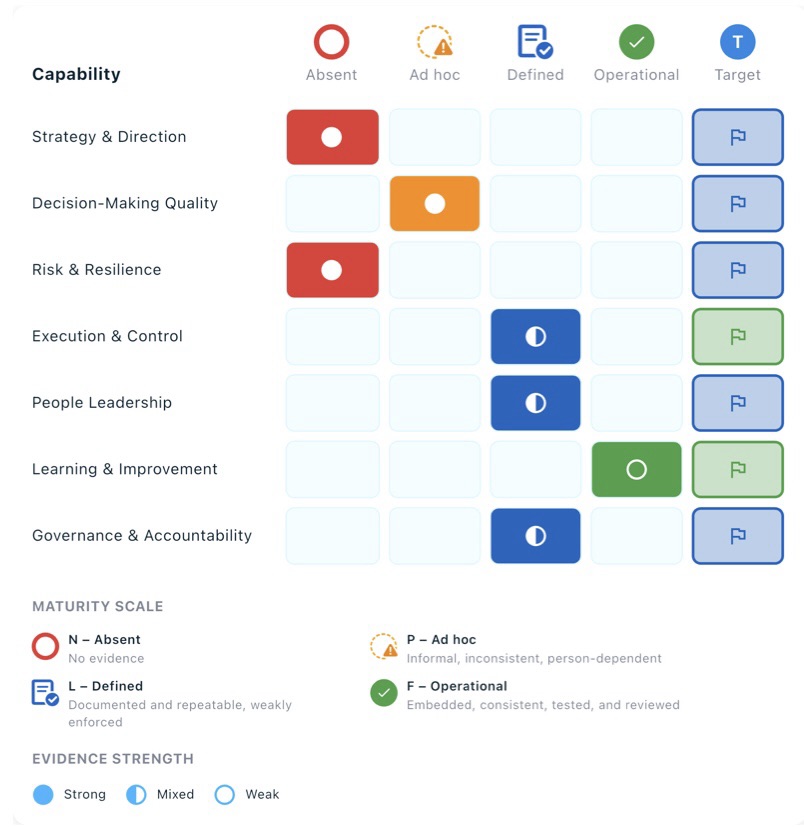
For this exemplary client, the “Integrated Risk & Opportunity Management” domain (line 3 in the heat-map below) needed to move from “Defined” to “Operational”. While “Planning, Objectives, Strategies and Change” is fully operational.
- Capability is more than potential
Walking the Talk: Why Theory Must Meet Practice
We’ve all met someone who can explain things perfectly — quote the books, name the principles, cite the research. But when it comes to putting those ideas to work, the magic fades. The truth is that theory without practice is like a plan without a journey; neat on paper, yet unrealized in life.
We live in a world overflowing with advice, frameworks, and “how-tos.” You can learn the theory of entrepreneurship, design, leadership, or even kindness. Yet none of it matters until it shows up in how you act, decide, and create. The unity of theory and practice is where real capability lives — it’s the difference between knowing what and mastering how.
The Power of Embodied Knowledge
Think of a skilled chef. They’ve read recipes and studied technique, but their genius only shines through repeated action — through tasting, refining, and failing. The dance between theory and practice creates experience, and experience becomes wisdom. Walking the talk, in this sense, means letting ideas live through your hands, your habits, and your results.
When you practice what you know, something shifts. Your understanding deepens. You start seeing nuances theory alone could never reveal. It’s discipline sharpened by doing, reflection built into motion.
Enabled Capability
Capability isn’t just the potential to perform; it’s the proven ability to execute — to make things happen well, consistently. It begins with knowledge but blossoms through the empowered act of applying that knowledge with intention. A team that executes well doesn’t just have skill; it has enabled capability — the conditions, openness, and trust that allow theory to become reality.
In an organization, that looks like leaders who model the values they preach, cultures that reward experimentation rather than perfection, and practices that adapt ideas through feedback and lived experience.
When Theory and Practice Walk Together
So, how do we unite them? Simple — one deliberate step at a time. Take what you know, apply it, observe what happens, and iterate. Whether you’re designing a community project or mastering a sport, keep your theory humble and your actions bold.
Ideas gain their truth only in motion. Walking it, not just talking it, is what turns intention into impact. It’s how we turn the abstract into the actual — and capability into excellence.
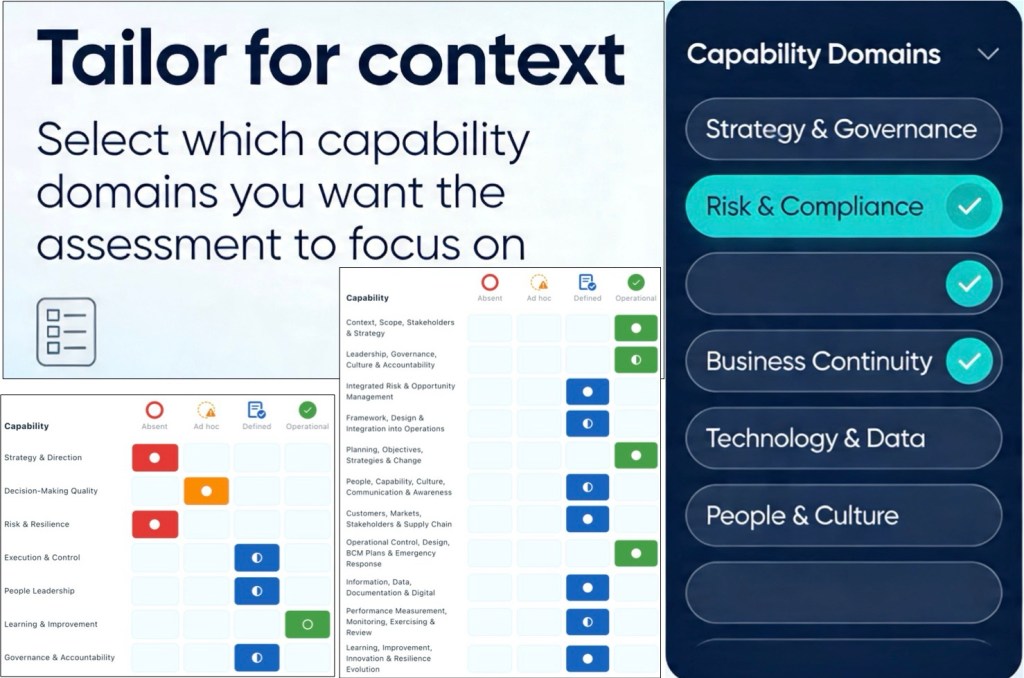
You can select all, some or one domain for us to focus on
- Capability Assessments and Context
“Assessment Context” is fundamental.
- What are your needs?
- What do you want explored?
- What data should be reviewed in that exploration?
We encourage you to select which capability domains you want the assessment to focus on (all, or some, or one).
Universal Framework
Options are listed in the “requirements section” of the Fiverr sign up
- Strategy & Direction: % of strategic objectives with owners, measures, & proven impact on decisions
- Decision quality: % of decisions made once that stick without reversal or major rework
- Risk & Resilience: % of critical risks with treatments that reduce exposure to target level
- Execution & Control: % of material initiatives delivered on time and within budget
- People Leadership: voluntary turnover rate in critical roles within target limits
- Learning & Improvement: reduction in repeat incidents or failures over time
- Governance & accountability: % of material issues closed on time
ALL, SOME, or ONE
Consolidated Framework
Options are listed in the “requirements section” of the Fiverr sign up
Two mandatory domains:
1. Understands context, stakeholders, and disruption, and uses this to set scope and strategy.
2. Leaders set direction and appetite; governance ensures oversight and accountability.
Nine options:
3. Risks, opportunities, and continuity needs are systematically identified, analysed, and updated.
4. Integrated management framework is tailored to context and embedded in operations.
5. Risk‑based objectives, plans, and continuity strategies guide and control material change.
6. People have the competence, information, and culture to deliver Q/E/R/BCM duties.
7. Customer, market, stakeholder, and supply‑chain needs and risks are actively managed.
8. Operations and critical activities are controlled via processes, BCM plans, and emergency response.
9. Information and digital tools for Q/E/R/BCM are controlled, reliable, and used for decisions.
10. Q/E/R/BCM performance and exposure are monitored, tested, and reviewed for assurance.
11. The organisation learns from experience and systematically improves and innovates resilience.
ALL, SOME, or ONE
NB1: Documentation requirements vary by context and are advised in package descriptions.
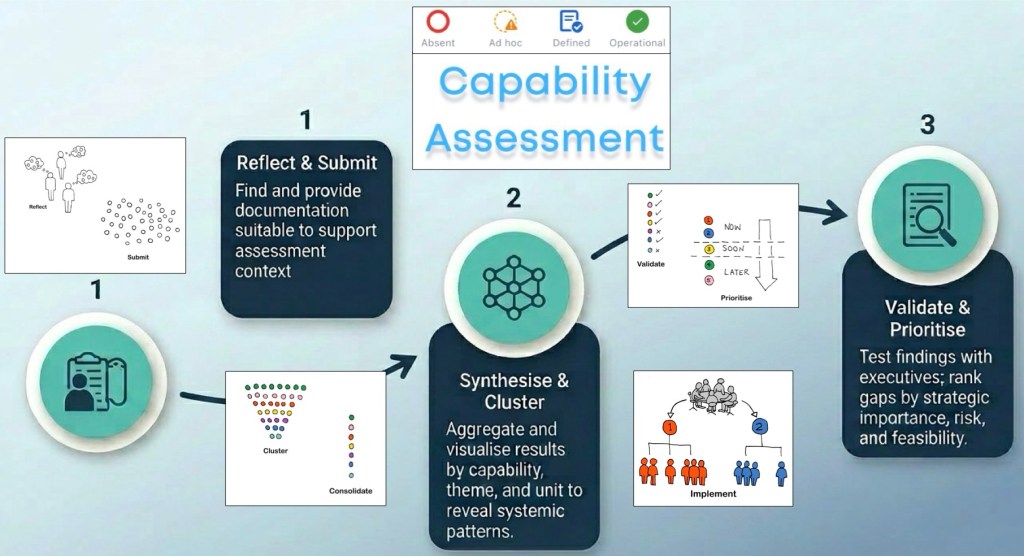
NB2: Where confidentiality precludes these options – see flow diagram below which is tailored to Operational Resilience package – we oversee self-assessment in step 2.
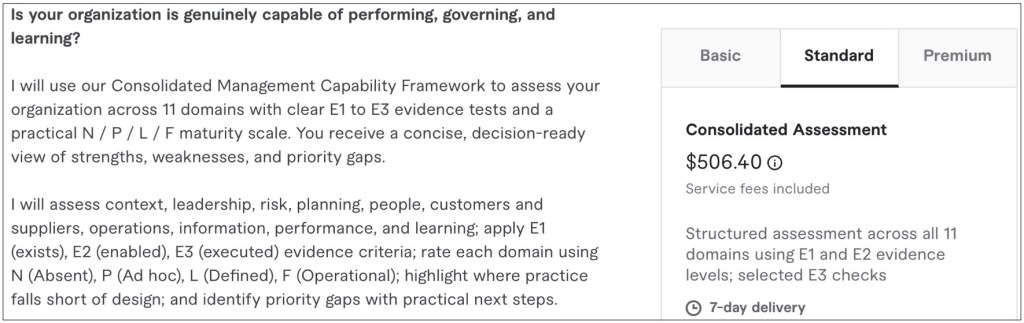
- Consolidated Assessment
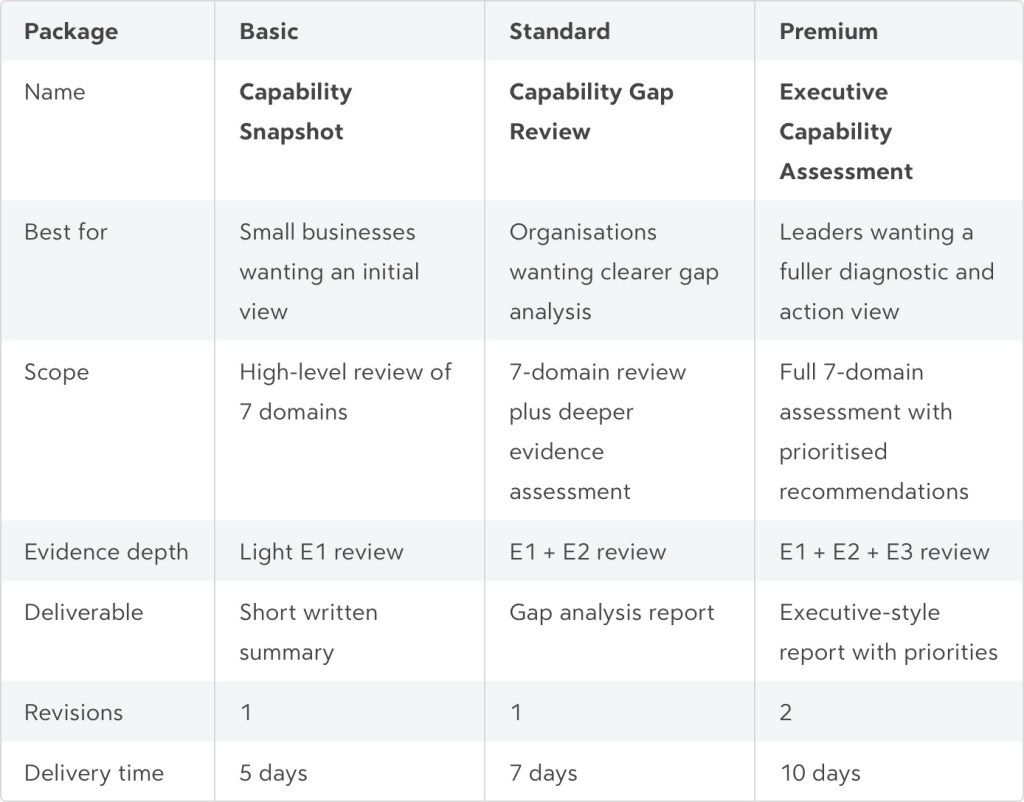
Executive Summary Exemplar (Basic Package)
The report shows a solid management-system foundation, with no domains rated Absent or Ad hoc, but the overall maturity is 59.1%, so the organisation is stronger in design than in consistent operational proof of use. Four domains are at Operational maturity and seven are at Defined maturity, which means the core opportunity is to convert documented processes into demonstrated decisions, behaviours, and improvement outcomes.
Executive summary
This is a credible, above-baseline capability position: strategy, governance, planning, and operational control are the strongest areas, and they are already operating at the target maturity level. The main weakness is not missing documentation; it is the lack of evidence that several frameworks are consistently shaping resource allocation, frontline behaviour, supplier resilience, analytics-led decisions, and continuous improvement.
A useful way to read the report is that E1 and E2 are broadly in place across domains, while E3 is the recurring breakpoint in 7 of the 11 domains. In practical terms, the organisation has built the system, but it has not yet shown enough repeatable proof that the system changes outcomes.
Strengths and gaps
- Strong strategic alignment: context, stakeholder analysis, scope, and objectives are documented, traceable, and used to steer initiatives and investment choices.
- Strong governance base: policies, governance structures, leadership participation, issue tracking, and accountability mechanisms are in place.
- Strong planning discipline: objectives, action plans, continuity strategies, and change assessments are defined and influence priorities and budgets.
- Strong operational resilience controls: key processes, BCM plans, and emergency procedures are documented, accessible, and evidenced in incidents or exercises.
- The biggest cross-cutting gap is operational evidence: in seven domains, the report records “YES” for process definition and deployment, but “NO” for proof that the capability is materially influencing decisions or outcomes.
- Risk and BIA are not yet clearly driving prioritisation and resource allocation, which limits the value of otherwise sound risk methods and registers.
- People capability, supplier resilience, information use, performance review, and improvement all show the same pattern: defined and repeatable, but not yet demonstrably embedded.
Domain maturity


Heat-map
The top priorities are to close the four target gaps first, then strengthen the lagging domains by proving routine use, not by writing more process material. If that sequencing is followed, the organisation should improve maturity fastest because the report already shows most core structures are in place.
Action roadmap
- In the next 30 days, create a single decision trail linking risk ratings, BIA outputs, treatment choices, continuity strategies, and funding or project approvals so that risk and continuity visibly drive priorities.
- In the next 30 days, redesign management review packs so every KPI, audit, exercise, and incident trend ends with a required decision, owner, due date, and follow-up check.
- In the next 60 days, run targeted exercises for the highest-impact services and use the results to update BIA assumptions, recovery strategies, supplier contingencies, and BCM plans.
- In the next 60 days, review critical suppliers and partners for single points of failure, then define diversification, fallback, contractual, or stockholding controls for the highest-risk dependencies.
- In the next 90 days, shift people capability from training completion to demonstrated competence by testing key roles in exercises, audits, and incident simulations, especially outside specialist teams.
- In the next 90 days, establish a benefits-tracked improvement portfolio that measures repeat incidents, nonconformities, near misses, and resilience gains so learning can be shown in hard outcomes.
The practical message for executives is simple: do not invest first in more framework design; invest in evidence of use, decision traceability, supplier resilience, management-review discipline, and measurable learning loops.
The above note is an example of an executive summary provided with the Basic Package.

Check capability, not compliance.
- Consolidated Capability Assessment (Health Check) Framework
An integrated synthesis of quality, risk, environmental, businesses continuity, and universal frameworks tailored to meet needs.
Heat-map (example)
1. Context, Scope, Stakeholders & Strategy
Capability criterion
The organisation understands its context, stakeholders, and disruption factors, and uses this to define scope, strategy, and objectives for quality, environment, risk, and continuity.
2. Leadership, Governance, Culture & Accountability
Capability criterion
Leadership sets direction, policy, and appetite, and governance structures provide oversight and accountability for quality, environment, risk, resilience, and continuity.
3. Integrated Risk & Opportunity Management
Capability criterion
Risks, opportunities, impacts, and continuity requirements are systematically identified, analysed, evaluated, and kept current across domains.
4. Framework, Design & Integration into Operations
Capability criterion
The organisation maintains an integrated management framework tailored to context and embedded in business processes.
5. Planning, Objectives, Strategies & Change
Capability criterion
Objectives, plans, and continuity strategies are risk-based, aligned with policy and appetite, and material changes are controlled.
6. People, Capability, Culture, Communication & Awareness
Capability criterion
People have the competence, information, and culture to deliver integrated Q/E/R/BCM responsibilities.
7. Customers, Markets, Stakeholders & Supply Chain
Capability criterion
The organisation manages customer, market, stakeholder requirements, and supply-chain dependencies, including quality, environmental, risk, and continuity expectations.
8. Operational Control, Design, BCM Plans & Emergency Response
Capability criterion
Operations, products/services, and critical activities are controlled through processes, BCM plans, and emergency arrangements.
9. Information, Data, Documentation & Digital
Capability criterion
Information, documented content, and digital tools supporting Q/E/R/BCM are controlled, reliable, and used for insight and decisions.
10. Performance Measurement, Monitoring, Exercising & Review
Capability criterion
Performance, exposure, and capability across Q/E/R/BCM are monitored, tested, and reviewed for insight and assurance.
11. Learning, Improvement, Innovation & Resilience Evolution
Capability criterion
The organisation learns from experience and systematically improves and innovates its integrated management and resilience capability.
Understand whether your organisation is capable, not just compliant.
- Understand whether your organisation is capable, not just compliant


- Alignment of the Universal Framework with the American Productivity & Quality Center’s Process Classification Framework®
The Universal Framework draws selectively from the management and support services portion of the American Productivity & Quality Center’s Process Classification Framework® (PCF) and reframes it as a maturity assessment rather than a process taxonomy.

What the PCF looks like
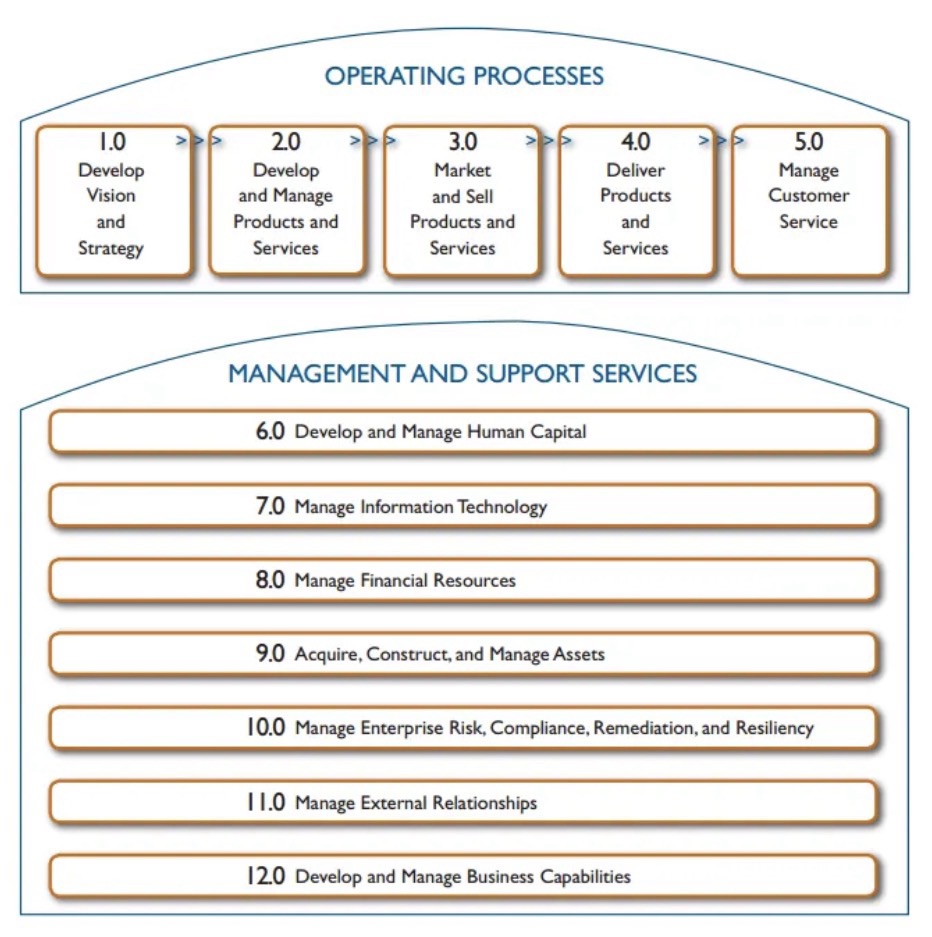
The PCF divides all enterprise work into two layers:
- Operating Processes: Develop Vision and Strategy (1.0), Develop/Manage Products and Services (2.0), Market and Sell (3.0), Deliver Products and Services (4.0), Manage Customer Service (5.0)
- Management and Support Services: Develop and Manage Human Capital (6.0), Manage IT (7.0), Manage Financial Resources (8.0), Acquire/Construct/Manage Assets (9.0), Manage Enterprise Risk, Compliance, Remediation and Resiliency (10.0), Manage External Relationships (11.0), Develop and Manage Business Capabilities (12.0)
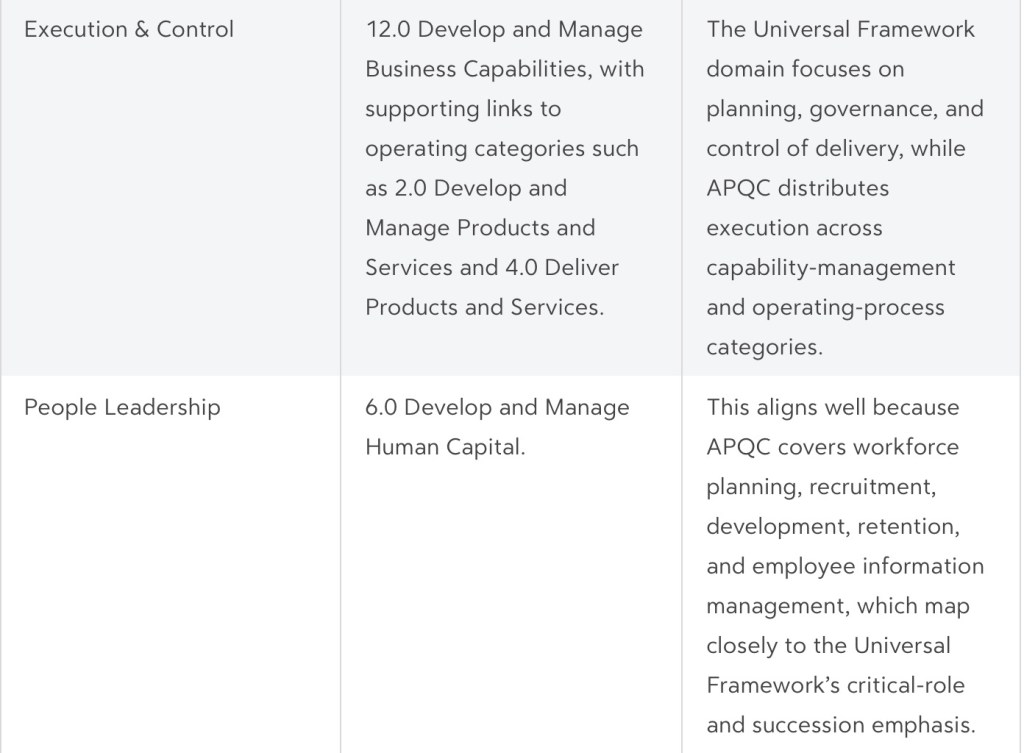
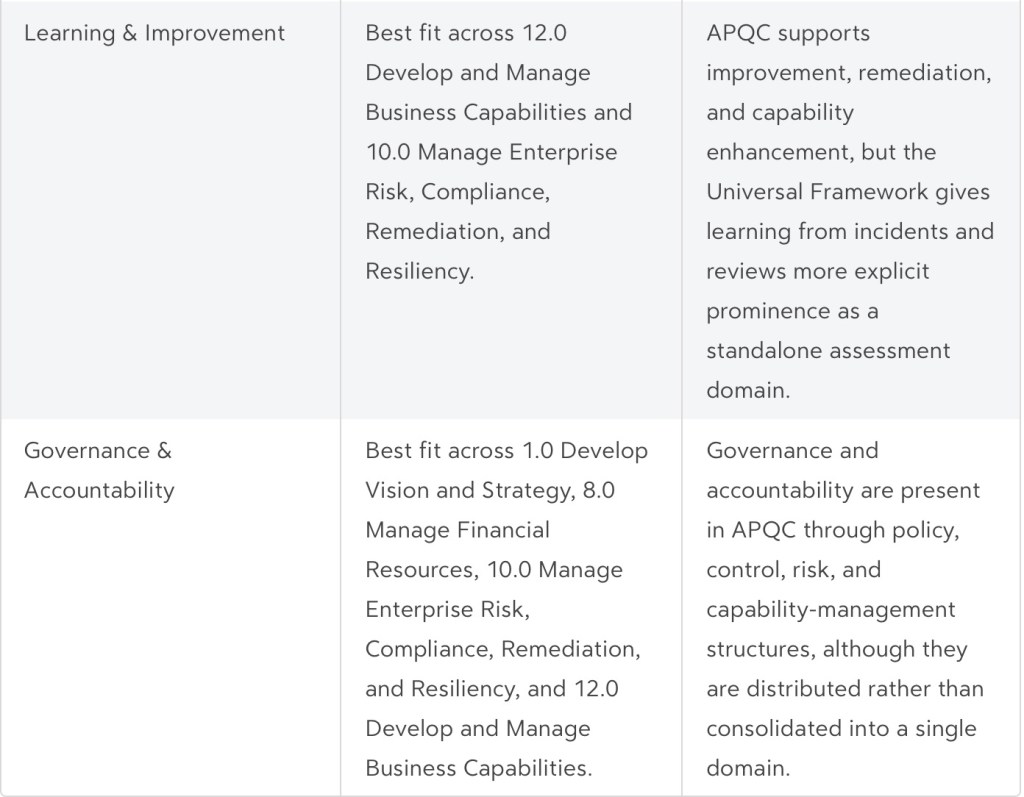
The PCF organises operating and management processes into 12–13 enterprise-level categories covering everything from product development to customer service, while the Universal Framework deliberately narrows to seven domains that test management capability quality rather than process existence or classification.
The PCF is a hierarchical process taxonomy – a classification tool intended for benchmarking what processes exist and how they are structured across organisations.
The Universal Framework is a maturity and evidence model – it tests whether processes are defined, applied, and producing results through E1, E2, and E3 questions. This means the two are complementary in intent but different in design logic.
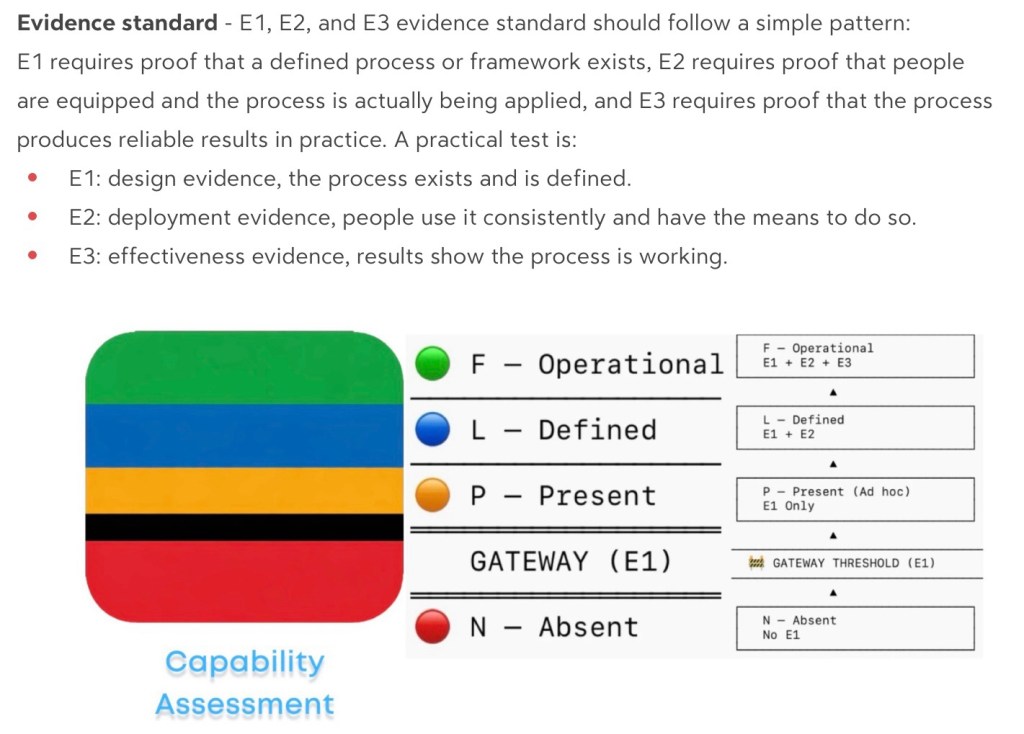
Evidence standard – E1, E2, and E3 evidence standard should follow a simple pattern:
E1 requires proof that a defined process or framework exists, E2 requires proof that people are equipped and the process is actually being applied, and E3 requires proof that the process produces reliable results in practice. A practical test is:- E1: design evidence, the process exists and is defined.
- E2: deployment evidence, people use it consistently and have the means to do so.
- E3: effectiveness evidence, results show the process is working.
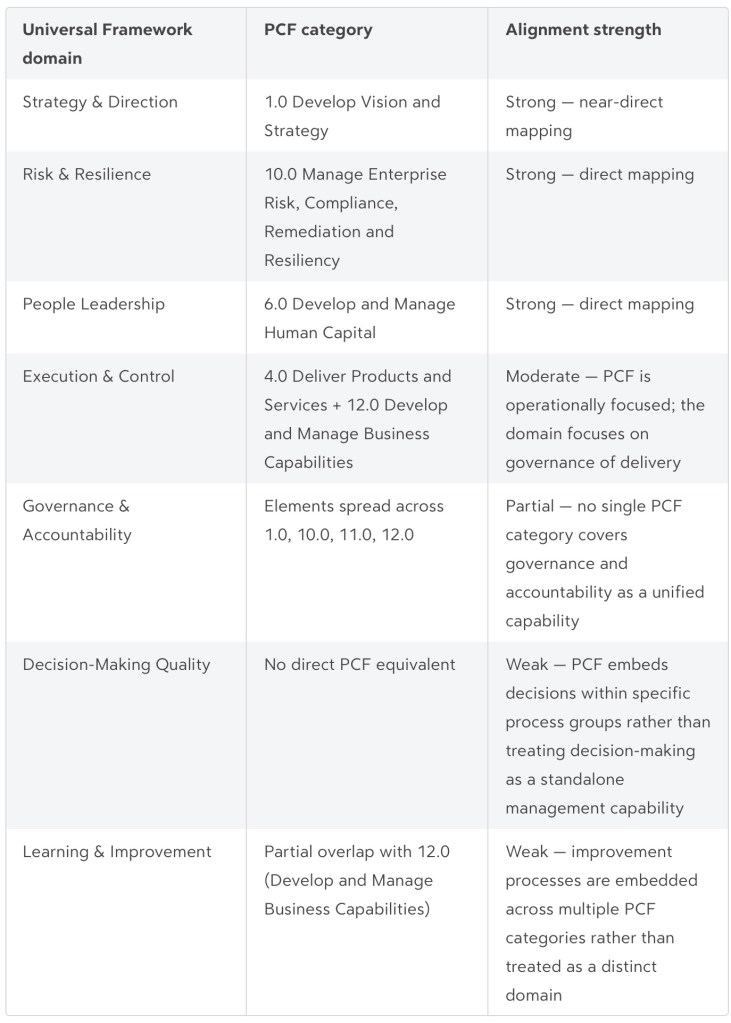
The Universal Framework is PCF-aligned at enterprise-management level, especially across strategy, human capital, risk/resilience, governance, and business capability management, but it is not a full substitute for the PCF’s operating-process taxonomy.
The Universal Framework asks, “Does the organisation have the capability and does it work?”, while APQC asks, “Which enterprise processes and process groups exist, and how are they classified for management and benchmarking?”
Alignment
Key structural differences
Three practical gaps stand out:
- The Universal Framework omits entire PCF operating categories — products, services, customers, IT, finance, and external relationships are not domains in the capability model, because these are operational functions rather than management capability dimensions.
- Decision-Making Quality has no PCF equivalent at the category level; APQC treats decision authority and escalation as embedded activities within specific process groups rather than as a cross-cutting management capability.
- Learning & Improvement is similarly distributed across multiple PCF categories (quality management, corrective action, knowledge management), whereas the Universal Framework treats it as a standalone domain with its own maturity ladder.
Overall verdict
The alignment is solid for four of the seven domains (Strategy, Risk, People, and partially Execution) and loose for the remaining three. The Universal Framework has been derived primarily from the management and support services half of the PCF, filtered down to the capabilities that most directly determine whether an organisation is well-led and controlled, (rather than whether it has documented every process in a taxonomy). This is a purposeful narrowing, but it means the two frameworks serve different purposes and should not be treated as equivalent.
Appendix
A best-fit crosswalk from the seven-domain Universal Framework to APQC PCF Level 1 categories and the most relevant Level 2 process-group anchors. It is best read as an alignment map rather than a strict one-to-one translation, because the Universal Framework assesses management capability through E1/E2/E3 evidence, while the PCF is a hierarchical taxonomy for processes and process groups.
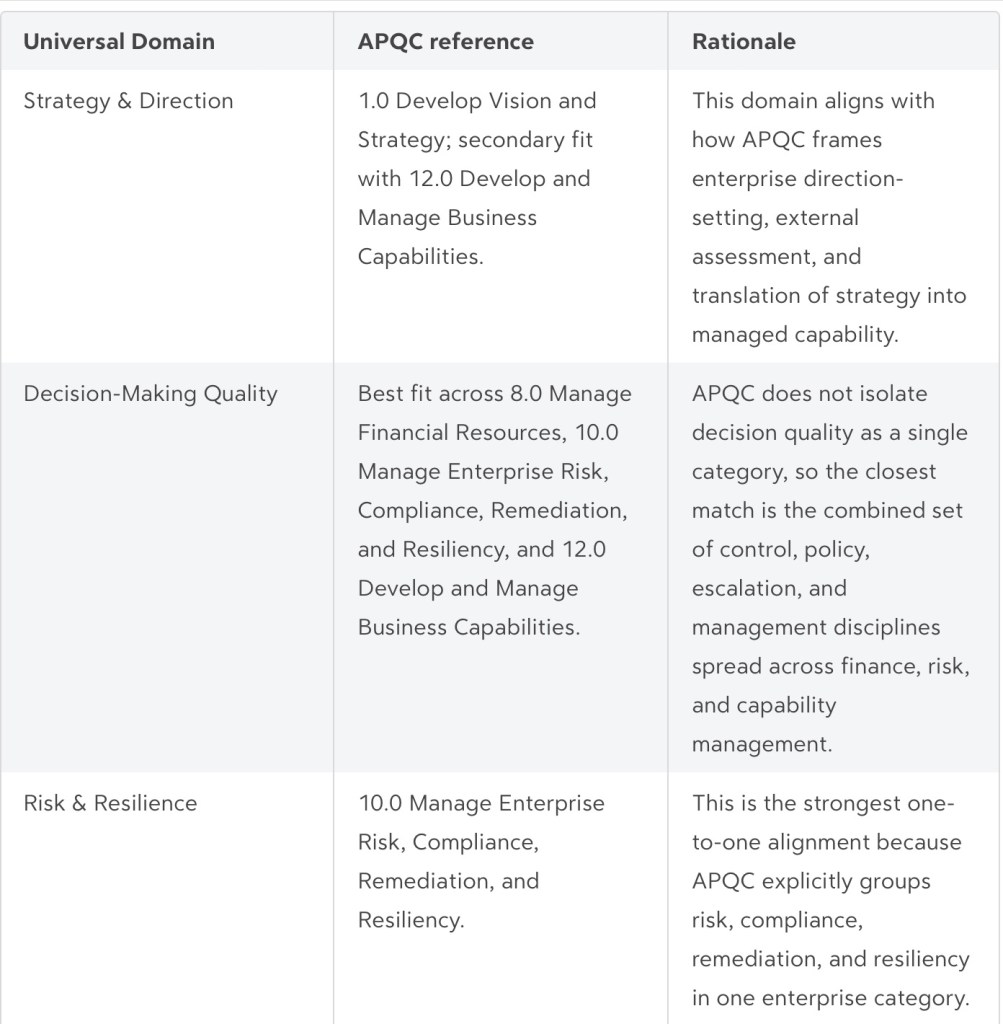
Appendix note: The Universal Framework is aligned to APQC at the enterprise-management level, particularly in strategy, human capital, risk and resilience, governance, and capability management, but it is not intended to replicate the full APQC operating-process taxonomy.
Understand whether your organisation is capable, not just compliant
- Unveiling a range of Gigs to meet your needs
We are pleased to launch a range of solutions which aim to meet various resilience needs by asking the right questions …
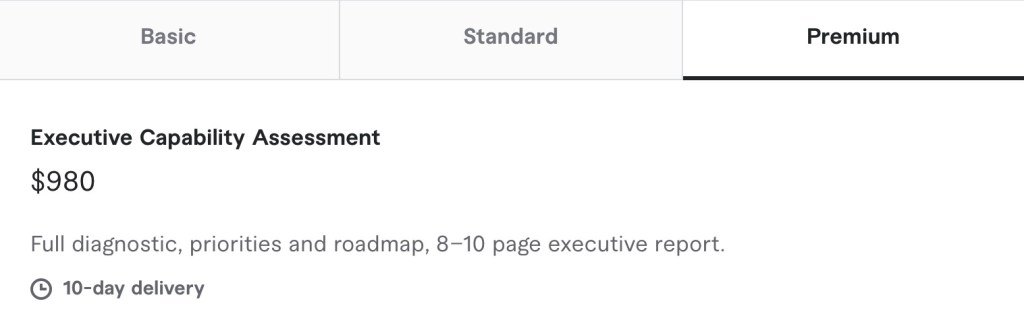
A diagnostic to identify your biggest gaps, immediate risks,
and the priorities to actions that matter.


Note: All pricing is displayed in USD


