
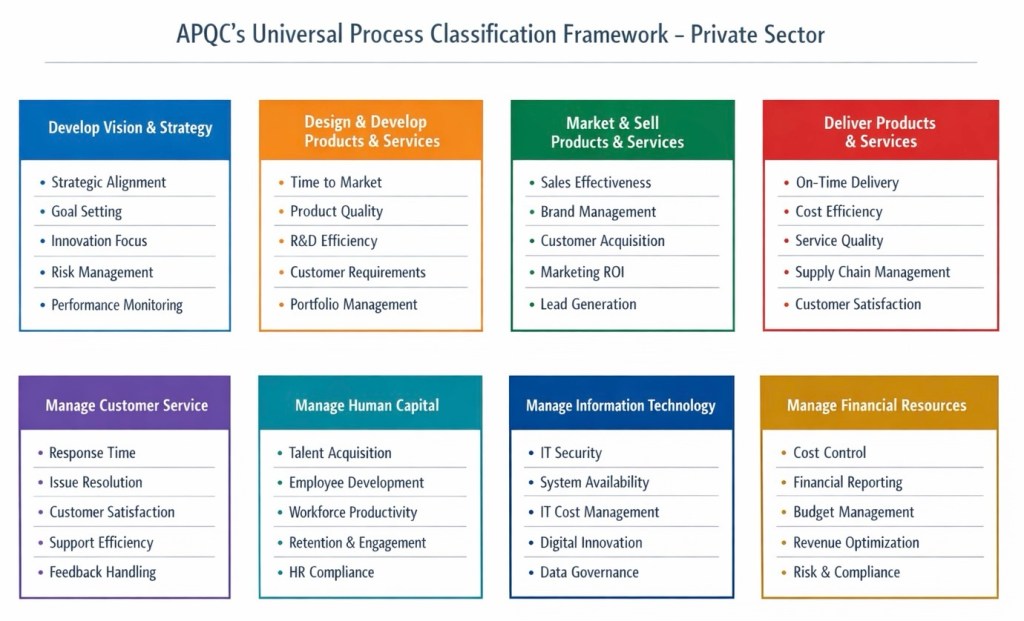
These categories represent the highest-level view of an end-to-end enterprise. The assessment criteria are key performance indicators (KPIs) that organizations typically use to measure the effectiveness, efficiency, and output quality of each process category.
Key Application: This framework allows organizations to map their processes, identify gaps, and benchmark performance against industry standards using these common criteria, driving focused improvements in process maturity and overall business performance.
1 Develop Vision and Strategy
Processes to define the organization’s purpose, long-term direction, and enable strategic decision-making.
Top 5 Assessment Criteria:
- Achievement of Strategic Goals: Percentage of defined strategic objectives (e.g., market entry, new product lines) met within the planning cycle.
- Market Share Growth/Position: Change in market share or competitive ranking attributed to strategic choices.
- Return on Strategic Investments (ROSI): Financial and non-financial return on key strategic initiatives (e.g., M&A, major CapEx).
- Stakeholder Alignment: Internal (board, leadership) and external (investor) confidence in the strategy, often measured by surveys.
- Strategic Planning Cycle Efficiency: Time and resource cost to produce an actionable, data-informed strategic plan.
2 Develop and Manage Products and Services
Processes to research, portfolio manage, design, develop, and launch new offerings.
Top 5 Assessment Criteria:
- Time-to-Market: Average cycle time from concept/ideation to commercial availability.
- Innovation Revenue Impact: Percentage of total revenue from products/services launched in the last 3-5 years.
- Development Cost vs. Budget: R&D and design spending variance against planned investment.
- Launch Success/Quality Rate: Measured by customer acceptance, defect rates at launch, or achievement of first-year sales targets.
- Portfolio Vitality Ratio: Proportion of projects in the pipeline representing incremental vs. transformative innovation.
3 Market and Sell Products and Services
Processes to understand the market, create demand, and execute the sales transaction.
Top 5 Assessment Criteria:
- Sales Growth & Win Rate: Year-over-year revenue increase and percentage of qualified leads/proposals that convert to sales.
- Customer Acquisition Cost (CAC): Total sales and marketing cost per new customer acquired.
- Sales Pipeline Velocity: The speed at which opportunities move from creation to closure.
- Brand Strength & Market Reach: Measured by awareness surveys, digital engagement metrics, or channel penetration.
- Marketing Return on Investment (MROI): Revenue attributable to marketing campaigns relative to their cost.
4 Deliver Products and Services
The core operational processes to plan, source, make, and fulfill customer orders (Supply Chain & Operations).
Top 5 Assessment Criteria:
- Perfect Order Fulfillment (On-Time, In-Full, No Errors): The primary measure of operational reliability.
- Total Delivered Cost / Cost of Goods Sold (COGS): Efficiency of the end-to-end production and delivery cost structure.
- Order-to-Cash Cycle Time: The speed and efficiency of the entire workflow from customer order to payment receipt.
- Asset Utilization & Inventory Turns: Efficiency in using physical assets (plant, equipment) and working capital (inventory).
- Operational Quality Yield: Internal defect rates, scrap, and rework costs.
5 Manage Customer Service
Processes to provide post-sale support, manage customer relationships, and enhance retention.
Top 5 Assessment Criteria:
- Customer Satisfaction (CSAT) & Net Promoter Score (NPS): Direct measures of customer loyalty and experience.
- First-Contact Resolution (FCR) Rate: Percentage of customer inquiries resolved in the first interaction.
- Average Service Resolution Time: Mean time to resolve a customer issue from open to close.
- Customer Retention/Churn Rate: Percentage of customers retained over a specific period.
- Cost per Service Interaction: Operational efficiency of the service delivery function.
6 Develop and Manage Human Capital
Processes to recruit, develop, engage, and retain the workforce.
Top 5 Assessment Criteria:
- Employee Engagement Score & Voluntary Turnover Rate: Measures of workforce commitment and stability.
- Talent Pipeline Health: Time-to-fill critical positions and strength of succession plans for key roles.
- Training Effectiveness & Skills Progression: Impact of development programs on performance and promotion readiness.
- Productivity per Full-Time Equivalent (FTE): Revenue or output relative to headcount.
- Diversity, Equity, and Inclusion (DEI) Metrics: Representation across levels and inclusivity survey scores.
7 Manage Information Technology (IT) and Knowledge
Processes to plan, develop, maintain, and secure information assets, systems, and intellectual capital.
Top 5 Assessment Criteria:
- IT System/Application Availability & Reliability: Uptime percentage and mean time between failures (MTBF).
- IT Project Performance: Percentage of projects delivered on-time, on-budget, and meeting scope/requirements.
- Total Cost of IT Ownership (Relative to Revenue or Peers): Efficiency of IT spending.
- Data Quality & Security Posture: Accuracy and usability of data; number/severity of security incidents.
- Business User Satisfaction with IT Services: Internal customer feedback on support and system effectiveness.
8 Manage Financial and Physical Resources
Processes to plan, allocate, and steward financial assets, facilities, and other capital resources.
Top 5 Assessment Criteria:
- Financial Plan/Budget Variance: Accuracy of forecasting and adherence to financial plans.
- Return on Invested Capital (ROIC) / Return on Assets (ROA): Effectiveness in generating returns from financial and physical assets.
- Working Capital Efficiency (e.g., DSO, DIO, DPO): Metrics like Days Sales Outstanding that show cash flow management.
- Cost of Finance Function: Efficiency of the financial operations (e.g., cost to process a payment, close the books).
- Regulatory Compliance Rate (Tax, Reporting): Timeliness and accuracy of mandatory financial filings and obligations.


