John Salter’s Blog
Follow my ruminations
Get new content delivered directly to your inbox.
- Sound on paper but …

Yes, a familiar situation. You have a sound framework on paper but resilience is not embedded in how the organisation runs day to day.
1. Key weaknesses in current arrangements
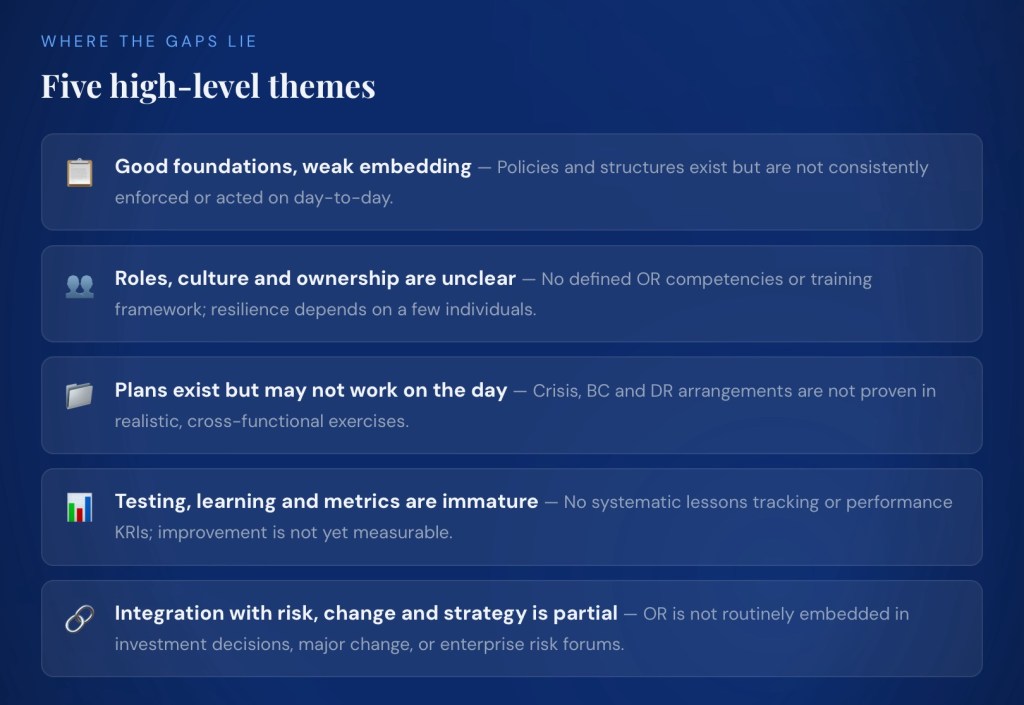
Illustration: today, if a major outage occurred, you would probably depend heavily on a few key individuals and ad hoc coordination rather than confidently lifting a set of tested, role‑based playbooks off the shelf.
2. Where plans, and accountability are unclear
- Governance: policy and committee structures exist, but OR is not yet fully integrated into enterprise risk, strategy, change, and assurance processes. This makes accountability blurry at executive level (who “owns” resilience outcomes versus activities).
- Critical services/BIA/risk: methodologies and outputs are defined, but they are not maintained as a “living” source of truth or consistently used across disciplines (IT DR, cyber, vendor management, etc.).
- Strategies & solutions: there is a defined approach and documented strategies, but alignment with risk appetite, budgets, change programs and other resilience initiatives is weak, so decisions during projects and investments may not consider resilience sufficiently.
- Roles & capability: there is no clear, organisation‑wide view of OR roles, competencies, and training/awareness expectations (e.g. crisis leaders, service owners, vendor resilience leads). People may not know what is expected of them in a disruption.
- Performance & continuous improvement: there is no agreed set of resilience metrics, review cadence, or link into issues/corrective action processes, so no one is clearly accountable for closing gaps and demonstrating improvement over time.
In practice, this means resilience is still seen more as a set of documents and projects than as a managed performance area with clear owners, measures, and consequences.
3. Practical priorities (what to fix first)
Focus first on the areas rated N (Absent) and P (Ad hoc), then strengthen linkages in the L (Defined) domains.
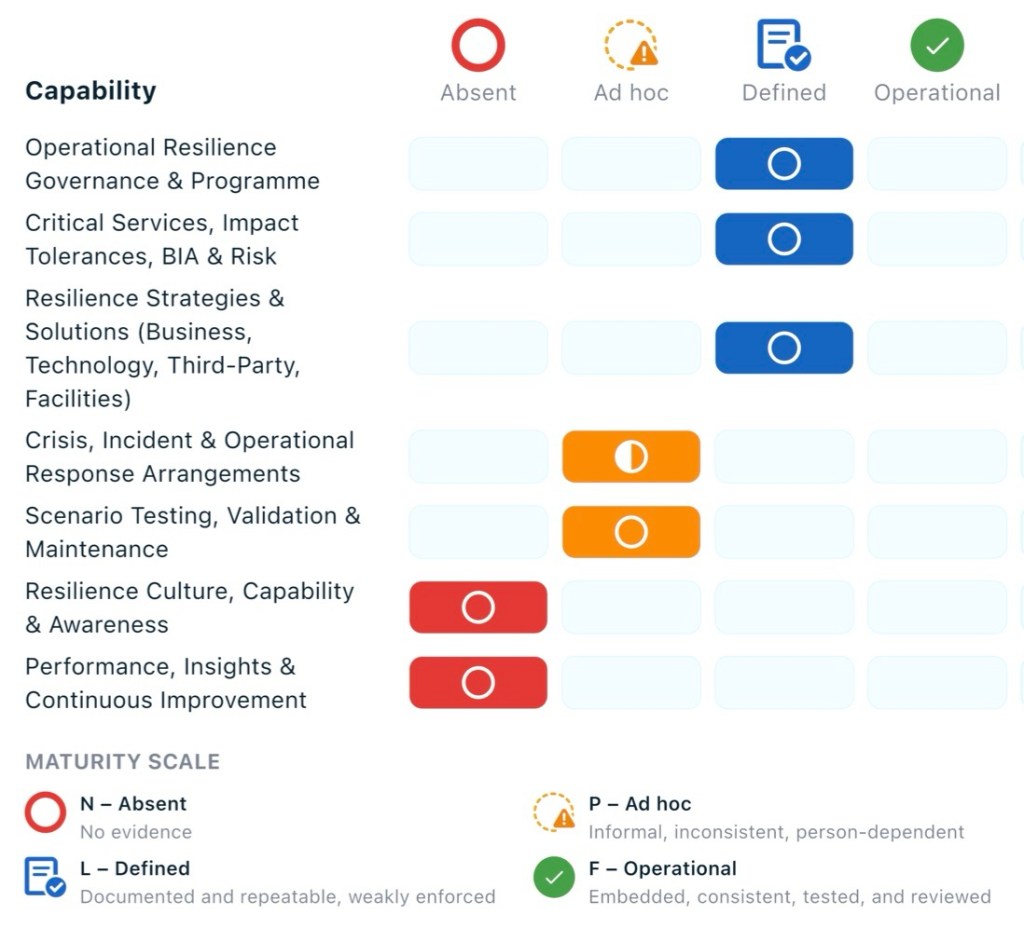
Capability Heatmap 1. Establish performance and oversight basics
(Performance, Insights & Continuous Improvement – N).
- Define a small, meaningful set of OR metrics/KRIs (e.g. critical service coverage, currency of BIAs and plans, test pass rates, incidents vs impact tolerances).
- Set a quarterly OR performance review rhythm into an existing executive or risk committee, with clear ownership for actions and tracking.
2. Build roles, skills, and awareness
(Resilience Culture, Capability & Awareness – N).
- Clarify key OR roles and responsibilities (service owners, crisis managers, BC coordinators, IT DR leads, vendor resilience owners) and map them to people.
- Create a simple training and awareness plan: short role‑based briefings for key roles, basic OR awareness for all staff, and targeted crisis/incident leadership training.
3. Make scenario testing and learning real
(Scenario Testing, Validation & Maintenance – P).
- Use the existing testing framework to run a small number of high‑value, cross‑functional exercises focused on top critical services and impact tolerances.
- Implement a central lessons‑learned log with owners and due dates, linked to change, risk, and improvement processes so fixes are actually delivered.
4. Strengthen the usability of response arrangements
(Crisis, Incident & Operational Response – P).
- Prioritize 3–5 key crisis and incident playbooks and BC/DR plans for simplification into short, role‑based, action‑oriented guides.
- Confirm how plans are accessed in a crisis (including offline) and test this in exercises to make sure people can find and use them quickly.
5. Keep critical services, BIAs and strategies “alive”
(Governance, Critical Services, Strategies – L).
- Stand up a single source of truth for critical services, impact tolerances, BIAs and key risks, with defined review triggers (annual plus event‑based).
- Embed explicit “resilience checks” into major change and investment processes so strategies and tolerances are considered and updated at design gates.
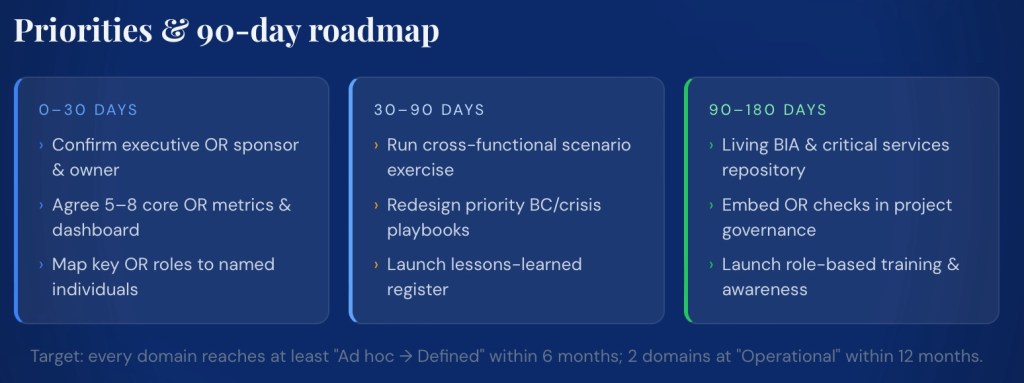
4. Concrete next 90–180 day actions
5. Use for board, client or internal discussions
- Position the assessment as evidence that the organisation has a defined framework but is in the early stages of embedding resilience into operations (overall maturity 28.6%, no domains yet at “Operational Strength”).
- Emphasize that immediate focus is on: clarifying roles and accountability, demonstrating performance through metrics and testing, and simplifying/operationalising response arrangements.
- Show a simple roadmap (90–180 days) with clear milestones and owners rather than a long list of abstract improvements.
- For clients and regulators, highlight strengths in having defined methodologies, policies, and governance structures, while being transparent about the improvement plan for culture, testing, and performance management.
- The move from traditional Business Continuity Planning to Operational Resilience is real and growing
I have just finished having an interesting chat with a friend who works in Asia. We discussed how disrupted the world is – and how, in his space, that involves businesses operating for part of the day, with ‘workarounds that recognize your backup generator is not going to get a steady fuel supply’ etc. It led me to reflect on the following question:
How strong is the move from traditional Business Continuity and RTOs to a focus on Operational Resilience and Impact Tolerance?
Where the shift is strongest
- Global large financial institutions and market infrastructures: firms now treat operational resilience as a distinct programme, not “BCM 2.0”, with service‑level testing against impact tolerances.[4][7][8][1]
- Tech and cyber‑exposed organizations: newer “ResOps” approaches explicitly map IT assets to critical services and continuously monitor performance against impact tolerances, moving beyond static RTO documentation.[7][9][1]
- UK financial services: FCA/PRA rules require firms to identify Important Business Services (IBS) and set/validate impact tolerances, making them board‑approved, audited metrics rather than optional add‑ons.[2][4][5][6]
Focus difference table
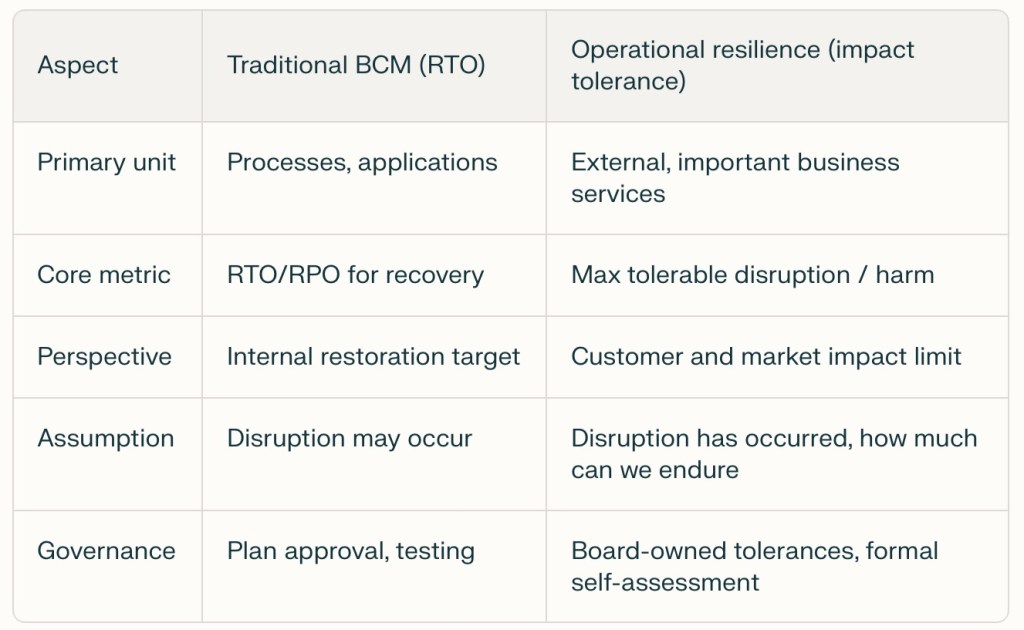
[3][6][10][11][1][2][7]
How impact tolerance changes the conversation
- RTOs are still used, but as subordinate levers; RTOs are typically set inside the impact tolerance window so that, even after recovery, there is time to clear backlogs and avoid breaching harm thresholds.[6][10][11][1][7]
- Impact tolerance reframes the question from “How fast can I recover this function?” to “How much disruption to this service, for whom, over what period, is just tolerable?” and forces explicit articulation of customer and systemic harm.[1][2][3][6][7]
- This in turn drives more emphasis on end‑to‑end mapping, third‑party dependencies, and “severe but plausible” scenario testing, which are less prominent in traditional RTO‑centric BCM.[9][2][3][4][1]
Where the shift is weaker or more nominal
- Outside regulated finance (e.g. many corporates, public sector), impact tolerance is often adopted as language or a maturity aspiration, while day‑to‑day planning and exercises still revolve around process‑level RTOs and recovery playbooks.[12][2][3][9]
- Even in financial services, some organizations struggle to operationalize tolerances, defaulting to relabelled RTOs rather than genuinely service‑level, harm‑based thresholds with monitoring and board challenge.[13][4][7][1]
Practical implication for your practice
- For regulated clients, the centre of gravity has clearly moved to impact‑tolerance‑led, service‑centric resilience, with BCM and RTOs nested inside.[2][3][4][7][1]
- For others, a hybrid approach is resonating: retain familiar RTOs and BIA, but re‑frame critical outputs as “important services” and translate RTOs into explicit tolerances for customer/ stakeholder harm to build a bridge toward full operational resilience.[8][10][11][7][2]
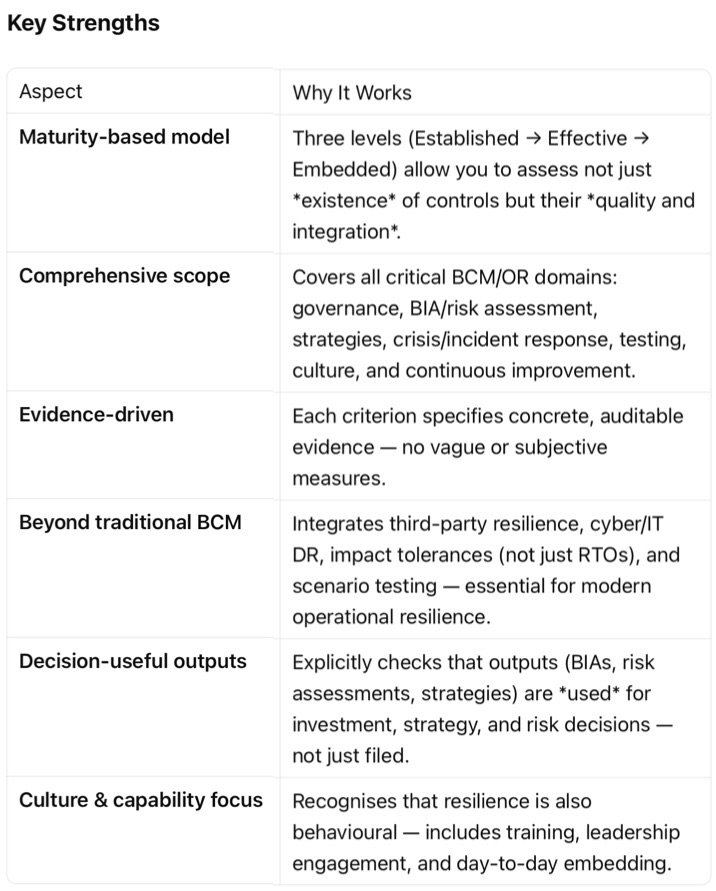
Our Resilience Review Packages have been third party assessed with the following strengths recognized:
Sources
[1] Operational Resilience vs Business Continuity: The Regulatory Shift … https://risktemplate.com/blog/2026-04-06-operational-resilience-vs-business-continuity-regulatory-shift/
[2] Impact tolerance in operational resilience: A guide for businesses https://www.everbridge.com/blog/impact-tolerance-in-operational-resilience/
[3] [OR] [Vs] Operational Resilience Versus Business Continuity … https://blog.bcm-institute.org/operational-resilience/or-vs-operational-resilience-versus-business-continuity-management
[4] Operational Resilience vs Business Continuity: A Comparison | Blog https://corporater.com/blog/operational-resilience-vs-business-continuity-a-comparison/
[5] [PDF] Guidance for Firm Operational Resilience https://www.cmorg.org.uk/sites/default/files/2025-04/CMORG%20-%20Guidance%20for%20Firm%20Operational%20Resilience%20v3%20-%20April%202025%20-%20TLP%20Clear.pdf
[6] [PDF] Impact Tolerances: Appetite for Disruption https://www.theia.org/sites/default/files/2021-05/Impact%20Tolerances%20-%20Appetite%20for%20Disruption%20May21.pdf
[7] Impact Tolerance Metrics and Operational Resilience : A Perspective https://sunandoroy.org/2025/10/28/impact-tolerance-metrics-and-operational-resilience-a-perspective/
[8] Evolving from Business Continuity to Full Operational Resilience https://www.dtcc.com/dtcc-connection/articles/2021/april/15/evolving-from-business-continuity-to-full-operational-resilience
[9] Operational Resilience Frameworks and Best Practices – Commvault https://www.commvault.com/explore/operational-resilience
[10] Impact Tolerance Vs Recovery Time Objective – BCM Institute Blog https://blog.bcm-institute.org/operational-resilience/impact-tolerance-and-recovery-time-objective
[11] Operational Resilience Update – Impact Tolerances – ISC https://iscltd.com/operational-resilience-update-impact-tolerances/
[12] RTO vs. RPO: What’s the Difference and How are They Used? https://riskonnect.com/business-continuity-resilience/rto-rpo-differences-and-uses/
[13] How are you determining your impact tolerances? – WTW https://www.wtwco.com/en-my/insights/2025/09/operational-resilience-how-are-you-determining-your-impact-tolerances
[14] Operational Resilience Series #3: Designing your impact tolerances https://www.protechtgroup.com/en-au/blog/operational-resilience-series-3-designing-your-impact-tolerances
[15] How to set RTO and RPO for business continuity – LinkedIn https://www.linkedin.com/posts/konkrit-solutions-ltd_when-a-disruption-happens-two-questions-activity-7353749543072464896-hI4Y
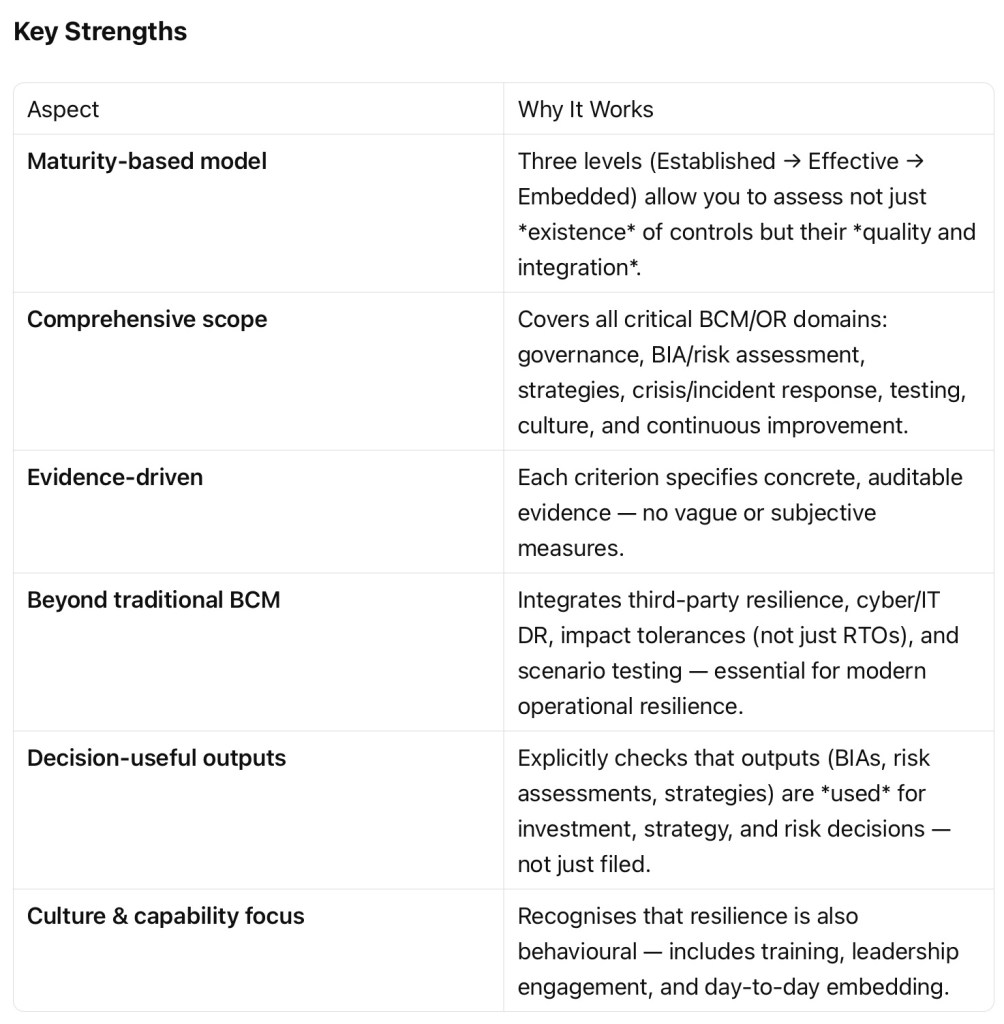
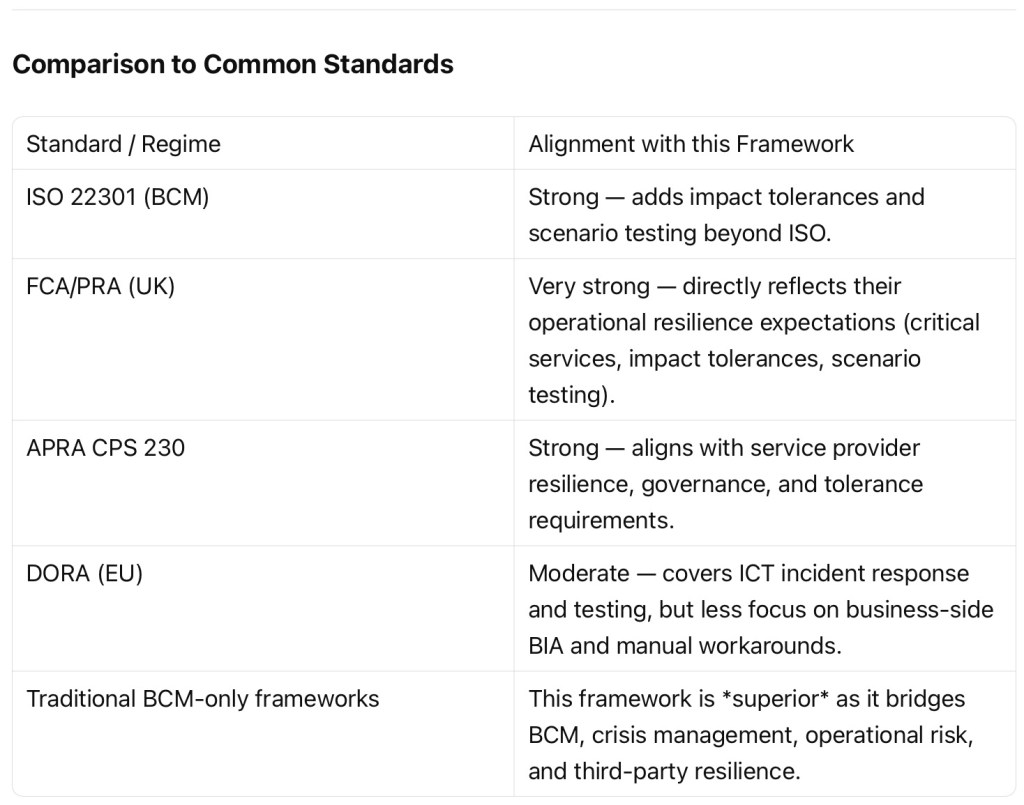
- Assessment of Operational Resilience Capability Framework’s Suitability
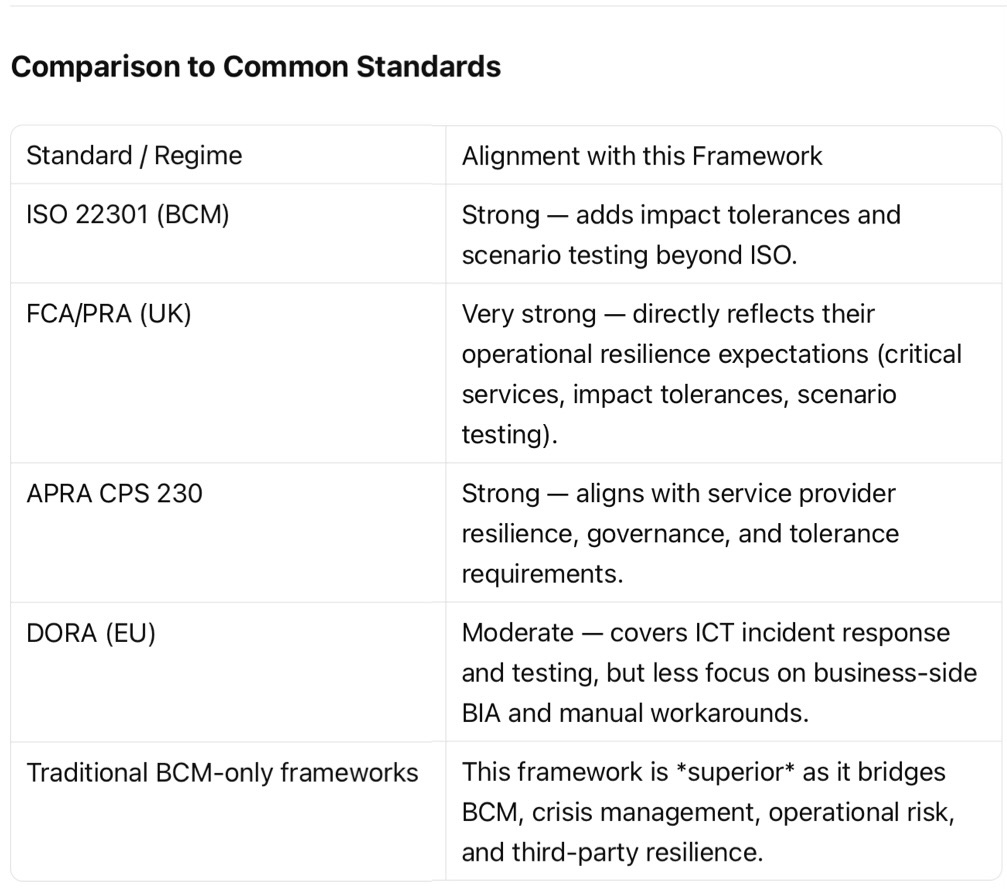
Summary This framework is well-designed for reviewing and assessing an entity’s Business Continuity Management (BCM) and Operational Resilience (OR) capability. It is professional-grade, aligned with regulatory expectations (e.g., UK FCA/PRA, APRA CPS 230, DORA), and suitable for internal audits, gap assessments, or external reviews.
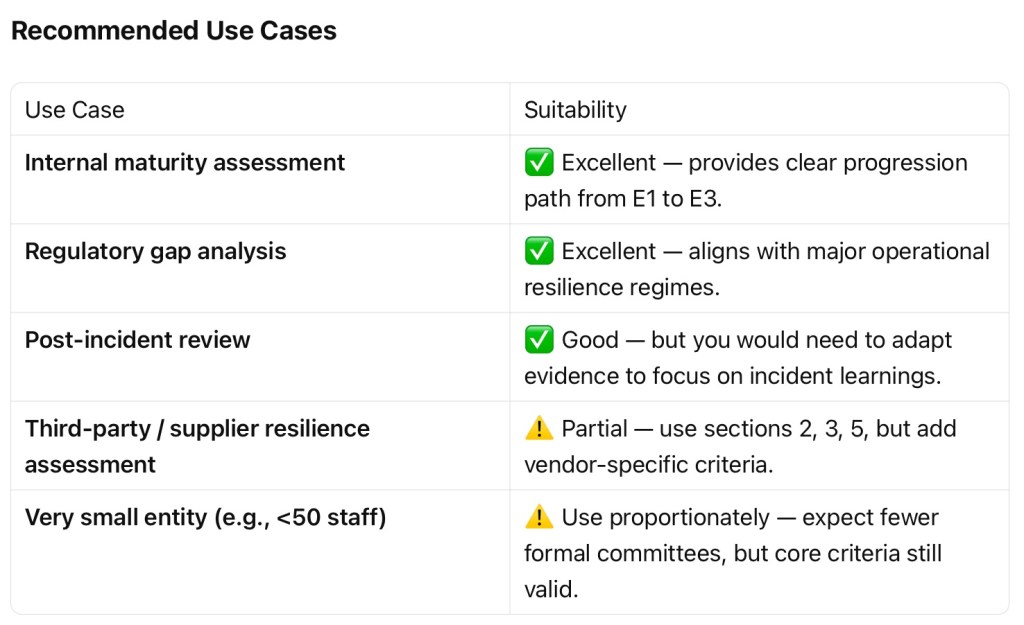
Recommendation
Use this framework as your primary assessment tool for reviewing BCM and operational resilience capability in medium to large regulated entities (financial services, critical infrastructure, healthcare, utilities).
For smaller entities, use it as a benchmark with proportionality adjustments.
Consider your most suitable review
- Business Continuity Review Document Checklist for Clients

This checklist supports clients to select and send the most relevant documents for their Chosen Review Package. If a document does not exist, the nearest equivalent can usually be substituted.
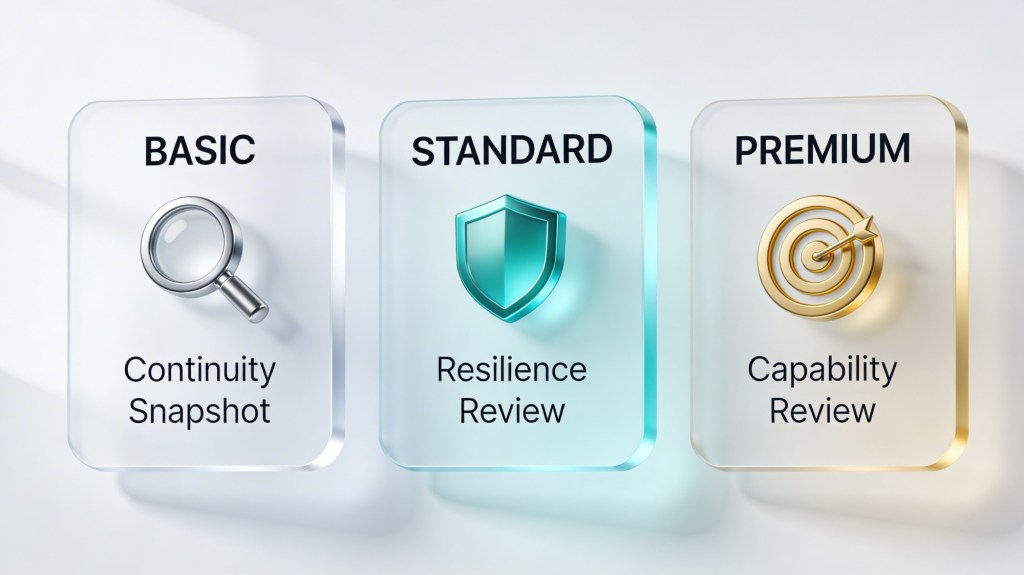
1. Basic – Continuity Snapshot
Please provide up to 3 documents:
- BCM policy, continuity framework, or top-level business continuity plan
- One current business continuity plan for a critical business area or service
- Most recent exercise report, test report, or post-incident review
2. Standard – Resilience Review + Call
Please provide up to 6 documents:
- BCM policy, continuity framework, or top-level business continuity plan
- Current enterprise risk register, with continuity or disruption risks if available
- Latest BCM risk assessment, if separate from the enterprise risk register
- One completed and approved BIA for a critical business unit or service
- One current business continuity plan for a critical business area or service
- Crisis or incident management plan with contact list
If available, exercise reports may also be included where they are more informative than a separate BCM risk assessment.
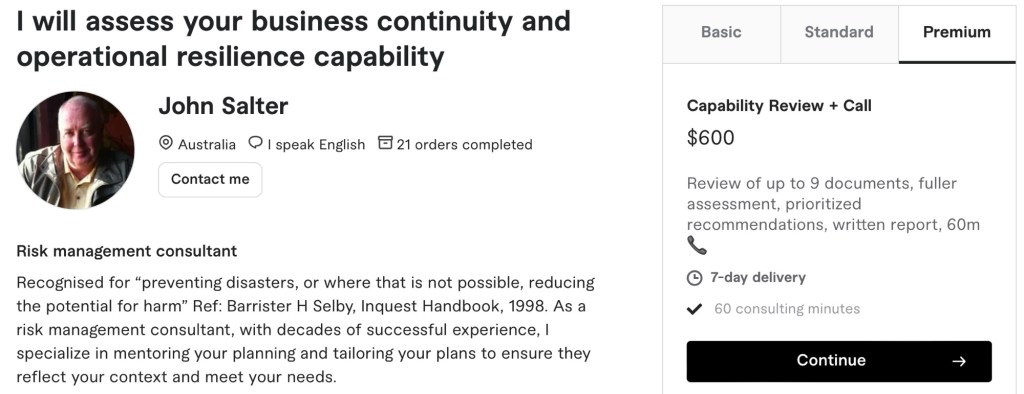
3. Premium – Capability Review + Call
Please provide up to 9 documents:
- BCM policy, continuity framework, or top-level business continuity plan
- Current enterprise risk register, with continuity or disruption risks if available
- Latest BCM risk assessment, if separate
- Completed and approved BIA for a critical business unit or service
- Documented continuity strategies or recovery strategy summary
- One current business continuity plan for a critical business area or service
- Crisis or incident management plan with contact list
- Last 2–3 exercise reports, test reports, or action logs
- Latest BCM audit report, independent review, or management review minutes
If available, a post-incident review from the last 2–3 years may be included in place of one exercise report.
Notes
- PDF, Word, Excel, and PowerPoint files are all acceptable.
- Draft documents can be provided, but approved versions are preferred.
- If unsure, send the closest equivalent and note what it is.
- NB Redaction of sensitive names, contacts, or commercial details is acceptable.
- Management Capability Assessment Report
Entity: Bayside Council (NSW)
Assessment basis: Publicly available documents only
Assessment status: Complete
Overall maturity: P (Ad hoc)
Maturity distribution: N = 1, P = 6, L = 0, F = 0Capability maturity summary
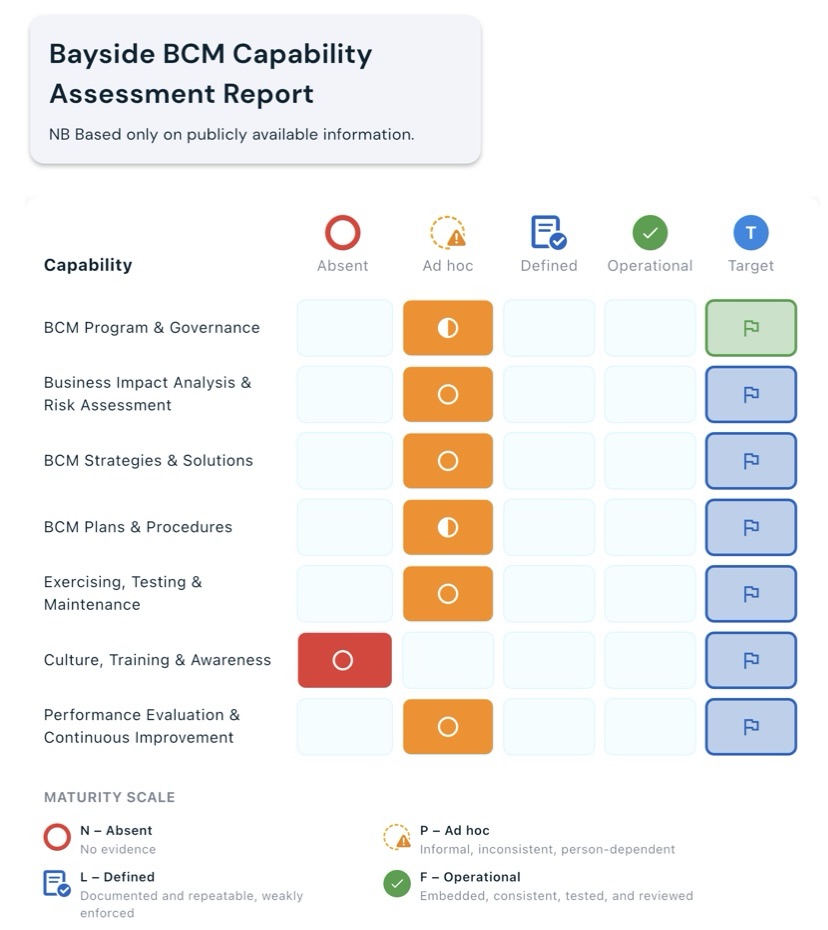
Assessment summary
The entity shows a visible BCM foundation through an approved BCM policy, broader risk management arrangements, a local emergency management plan, and audit and risk governance structures. The main limitation is that public evidence does not extend far beyond framework-level documentation.
This means the organisation appears to have continuity architecture in place, but there is not enough publicly available evidence to demonstrate that the programme is routinely exercised, maintained, measured, and improved in line with the E2 and E3 evidence standard.
Domain overview
BCM Program & Governance
Current: P (Ad hoc)
Assessment note: Formal policy and governance intent are in place, and committee oversight structures are visible. Evidence of repeated BCM decisions, resourcing, issue escalation, and integration into management review is limited in the public record.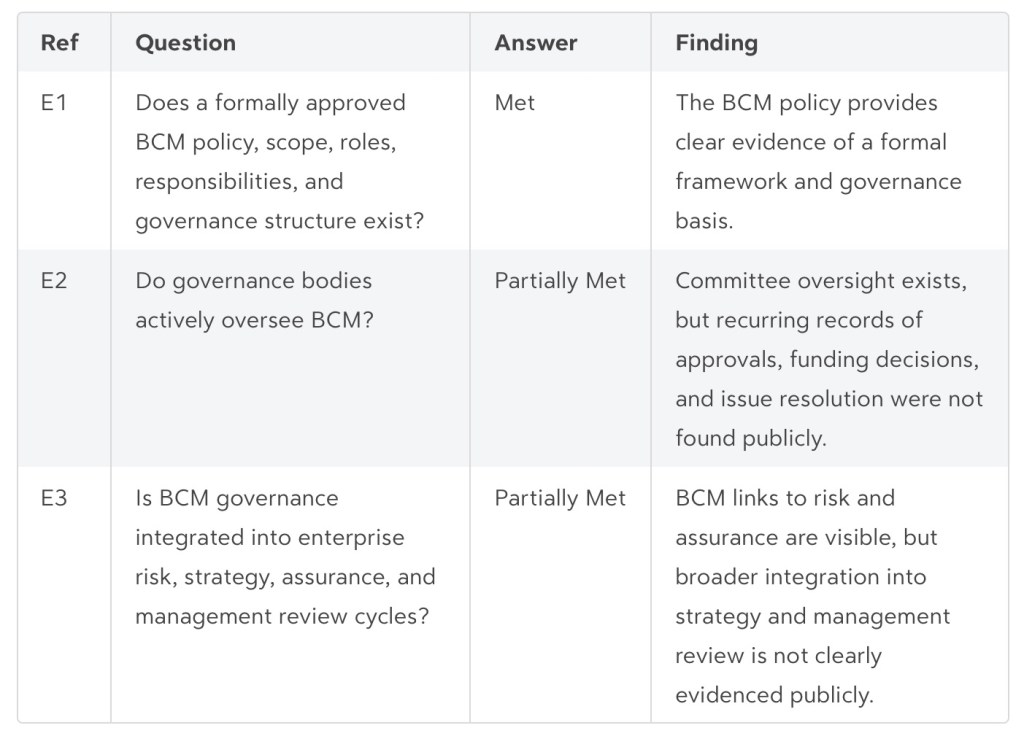
Business Impact Analysis & Risk Assessment
Current: P (Ad hoc)
Assessment note: The policy and risk material indicate that BIA and risk processes exist, but the core working artefacts were not publicly available.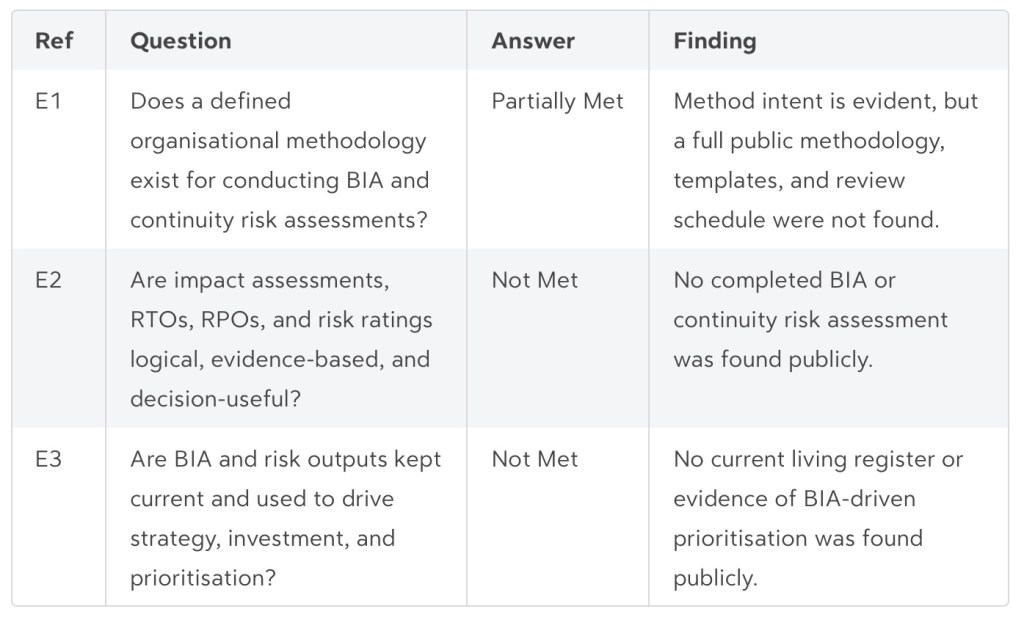
BCM Strategies & Solutions
Current: P (Ad hoc)
Assessment note: Recovery strategies are referred to in the policy, but the actual strategy evidence is not public.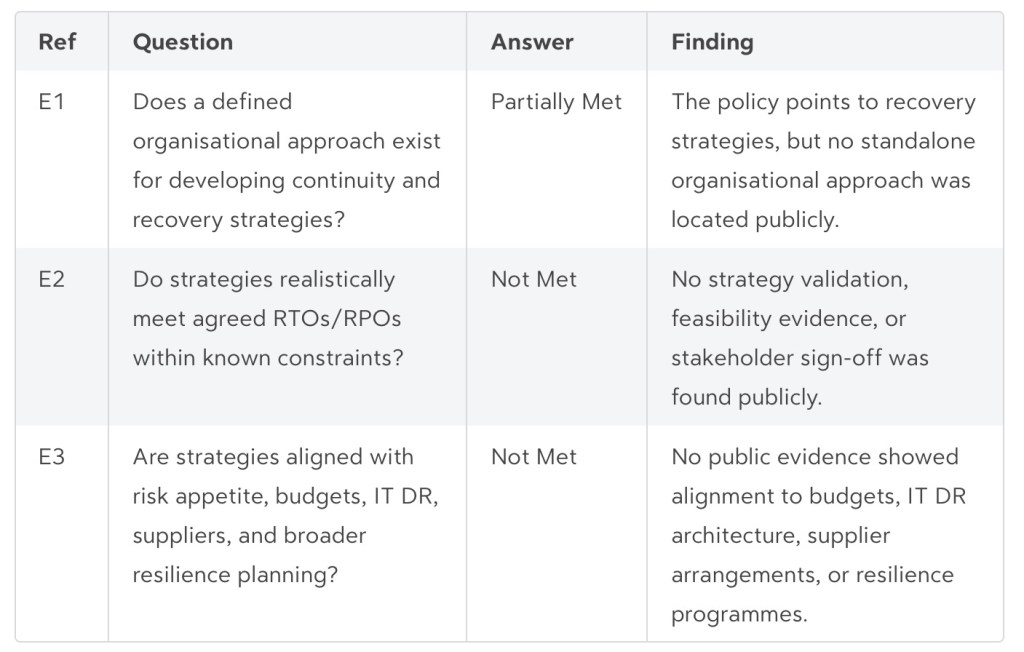
BCM Plans & Procedures
Current: P (Ad hoc)
Assessment note: There is evidence of a planning framework and at least one incident or emergency planning document, but not enough to confirm broader plan quality and maintenance.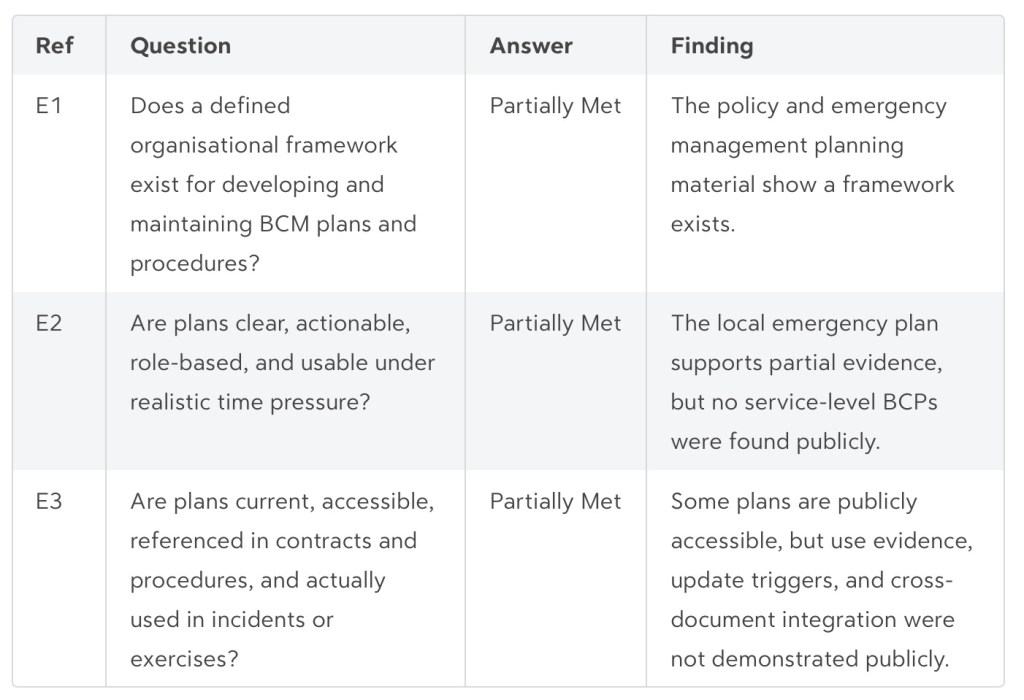
Exercising, Testing & Maintenance
Current: P (Ad hoc)
Assessment note: The programme expects exercising, but the evidence of actual testing and lessons is not public.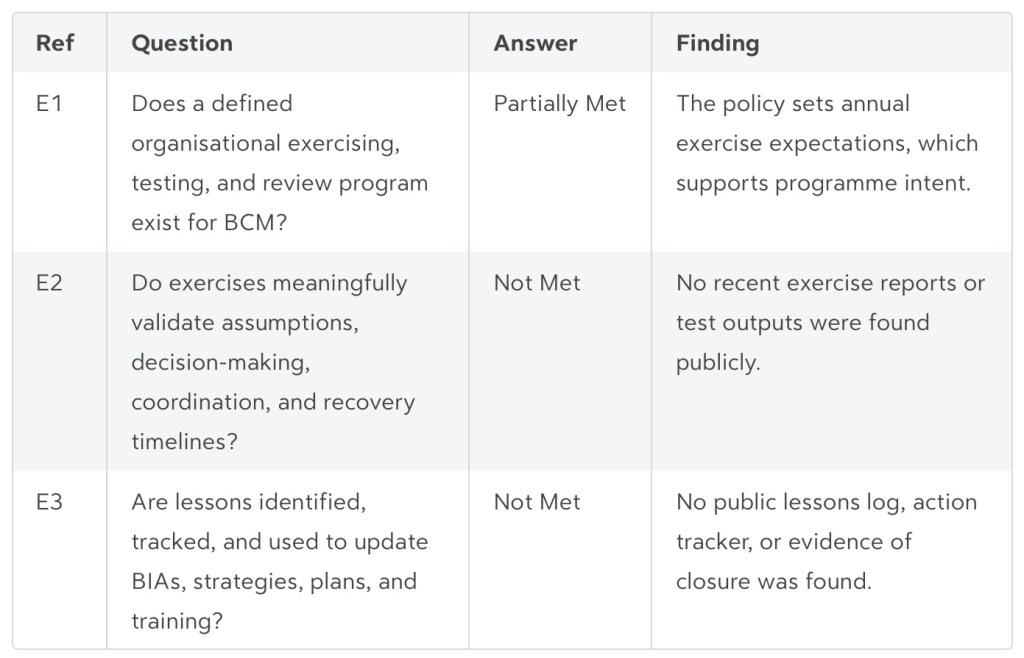
Culture, Training & Awareness
Current: N (Absent)
Assessment note: No public evidence was found to show a BCM training and awareness capability.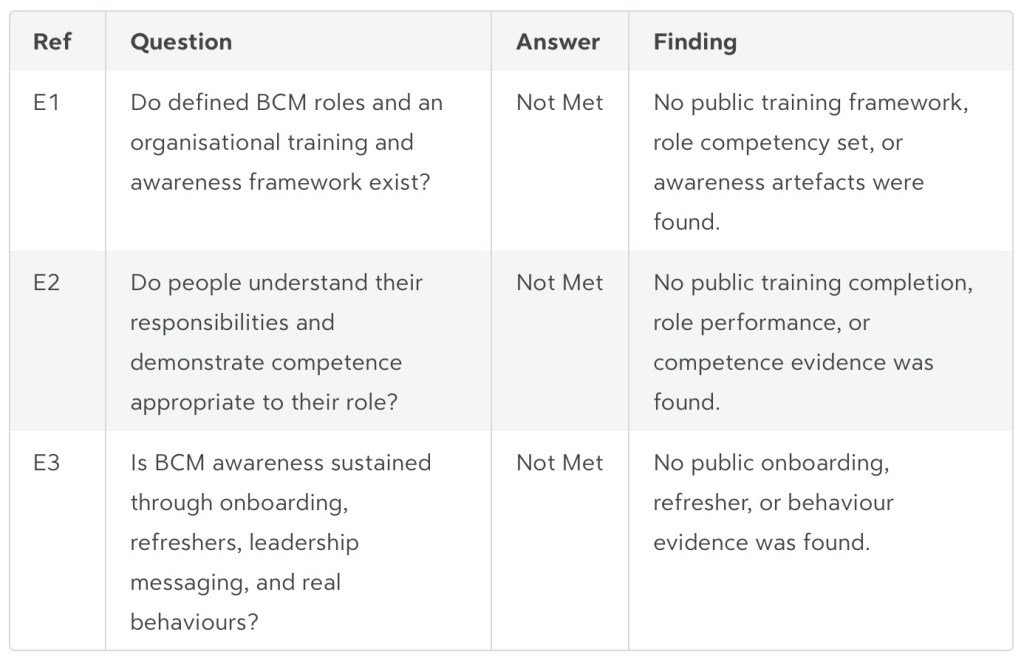
Performance Evaluation & Continuous Improvement
Current: P (Ad hoc)
Assessment note: Wider governance and assurance mechanisms exist, but BCM-specific evaluation evidence is limited.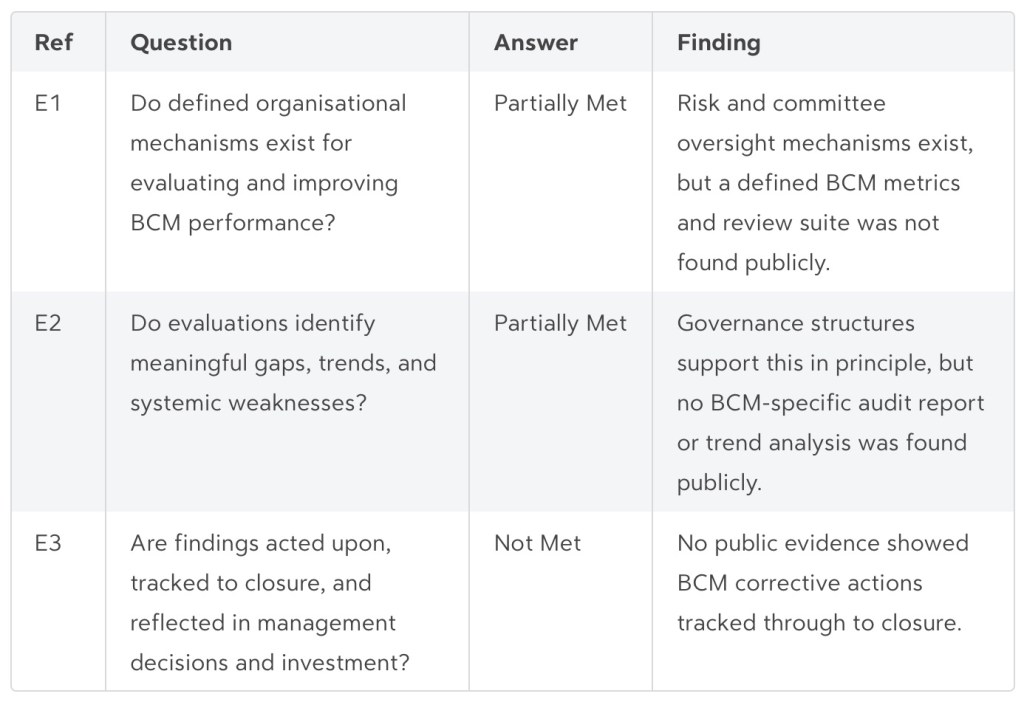
Strengths
A formal BCM policy exists and appears integrated with wider governance and risk arrangements.[3]
Emergency management arrangements are documented through the Local Emergency Management Plan.[2]
Audit and risk committee structures provide a visible oversight pathway for BCM-related matters.[4][3]Gaps
No public completed BIAs, service-level BCPs, continuity risk assessments, or current enterprise risk register were found.
No public exercise reports, post-incident reviews, training records, or lessons-action logs were found.[1]
Public evidence does not demonstrate sustained E3 integration into management review, investment, performance, or continuous improvement cycles.[1]
Enterprise oversight mechanisms exist, but no BCM-specific audit report, metrics pack, management review minutes, or action-closure evidence was found publicly. [3][4]Key findings
- The strongest capability area is governance, because the entity has a formal BCM policy and visible risk and oversight structures.
- The weakest capability area is culture, training, and awareness, because no supporting public evidence was found.
- Across most domains, the main gap is not policy intent but lack of public operational evidence such as completed BIAs, validated strategies, service-level plans, exercise reports, training records, and corrective action logs.
Overall judgement
Bayside Council is a good public example of a continuity programme with visible policy and governance foundations, but the public evidence set is insufficient to demonstrate a fully defined or operational capability under the report’s necessary-and-sufficient E1/E2/E3 standard.[3][2][1]
This entity is a credible example of a continuity programme with basic design elements in place, but it does not meet the evidence threshold for a defined or operational programme on publicly available material alone. Internal records may support a higher rating, but they were not available for this review.
Sources
[1]
[2] [PDF] BAYSIDE Local Emergency Management Plan 2021 https://www.bayside.nsw.gov.au/sites/ default/files/2024-06/BaysideEMPLAN.pdf
[3] [PDF] Audit, Risk & Improvement Committee Terms of Reference 22 May … https:// http://www.bayside.nsw.gov.au/sites/default/files/2024-07/ Audit_Risk_and_Improvement_Committee_(ARIC)_Terms_of_Reference.pdf
[4] [PDF] Agenda of Risk & Audit Committee – 27 September 2018 https://www.bayside.nsw.gov.au/ sites/default/files/2018-09/ Risk%20and%20Audit%20Committee%20Agenda%2027%20September%202018.pdf
[5] [PDF] Business Continuity Management Policy | Bayside Council https://www.bayside.nsw.gov.au/ sites/default/files/2020-05/Business%20Continuity%20Management%20Policy.pdf
Click Here
- Is Resilience Core?
“Can we demonstrate, with evidence, that our most important services will remain within acceptable limits during severe but plausible disruption?”

Yes. Strong business continuity and operational resilience capabilities are now core business necessities because organizations face an increasingly fractured risk landscape shaped by geopolitical, environmental, societal, and technological disruption.

Recent FCA observations also say that outages, cloud-service incidents, and cyber-attacks have reinforced the need for strong resilience and for treating it as a core business capability, not a side exercise.
Why now
The case is stronger today because disruption is no longer an occasional exception; it is part of the operating environment. The World Economic Forum says current risks span short-, medium-, and long-term horizons, which means leaders have to manage immediate shocks while also preparing for deeper structural threats.

The practical triggers are familiar: cyber incidents, third-party outages, supply-chain dependencies, and broader instability. The global average cost of a data breach reached USD 4.88 million last year, showing that failure to prevent, absorb, and recover from disruption has direct, significant financial consequences.[1]
What these capabilities do
Business continuity helps an organization keep critical activities going or restore them quickly after disruption, while operational resilience focuses on keeping important services within tolerable limits even under severe but plausible scenarios. That difference matters because firms are judged not only on whether they have plans, but on whether customers, revenue, compliance, and trust can survive a real-world shock.

What strong looks like
Strong capability usually means a few things are in place and actually work: clear governance, identified critical services, mapped dependencies, tested recovery strategies, and evidence that leaders understand where tolerances could fail.
Stronger firms are using board-ready self-assessments, rigorous testing, third-party scrutiny, and investments such as immutable backups, standby data centres, and alternate processing capability.
Just as important, resilience has to be dynamic rather than static. Scenarios that once seemed implausible may now be more likely, so firms need regular review, annual assessment, and ongoing adaptation rather than one-off compliance activity.
Leadership view
For boards and executives, this is now a strategic capability, not simply a risk or compliance program. Firms that invest in operational resilience are better positioned to innovate, attract customers, support market confidence, and sustain long-term growth.
Resilience is most valuable when it is evidenced, tested, and embedded into organizational capability rather than documented only in plans.
In current conditions, the better question is no longer whether these capabilities are important, but how mature they are and whether they are strong enough for the disruptions a firm is now likely to face.
Sources
[1] at a glance: Time-consuming… https://www.ibm.com/think/insights/cost-of-a-data-breach-2024-financial-industry
[2] Global Risks Report 2025 | World Economic Forum https://www.weforum.org/publications/global-risks-report-2025/
[3] The Global Risks https://reports.weforum.org/docs/WEF_Global_Risks_Report_2025.pdf
[4] Global Risks 2025 https://www.youtube.com/watch?v=ZByv6OZCoAg
[5] Global Risks 2025 | World Economic Forum Annual Meeting 2025 https://www.youtube.com/watch?v=tT1o33Ph_Ns
[6] Global Risks Report 2025 – WITA https://www.wita.org/atp-research/wef-global-risks/
[7] UK Operational Resilience Rules: Are You Ready for 31 March 2025? https://www.sidley.com/en/insights/newsupdates/2025/01/uk-operational-resilience-rules-are-you-ready-for-31-march-2025
[8] Global Risks Report spells out top risks for 2025 and beyond | Zurich https://www.zurichna.com/knowledge/articles/2025/02/global-risks-report-spells-out-top-risks-for-2025-and-beyond
[9] Insights from IBM’s 2024 Cost of a Data Breach Report | Enzoic https://www.enzoic.com/blog/ibms-2024-cost-of-a-data-breach/
[10] Operational resilience: insights and observations one year on – FCA https://www.fca.org.uk/publications/good-and-poor-practice/operational-resilience-insights-observations-one-year
[11] The Global Risks Report: These are the top risks facing the world in 2025 https://www.zurich.com/insights/business/the-global-risks-report-2025
[12] 2024 IBM Breach Report: More breaches, higher costs https://blog.barracuda.com/2024/08/20/2024-IBM-breach-report-more-breaches-higher-costs
[13] Operational Resilience Regulation 2025 Deadlines – Riskonnect https://riskonnect.com/operational-resilience/operational-resilience-regulation-2025-deadlines/
[14] Global Risks Report 2025 – Knowledge for policy https://knowledge4policy.ec.europa.eu/publication/global-risks-report-2025_en
[15] 7 Key Takeaways From IBM’s Cost of a Data Breach Report 2024 https://www.zscaler.com/blogs/product-insights/7-key-takeaways-ibm-s-cost-data-breach-report-2024
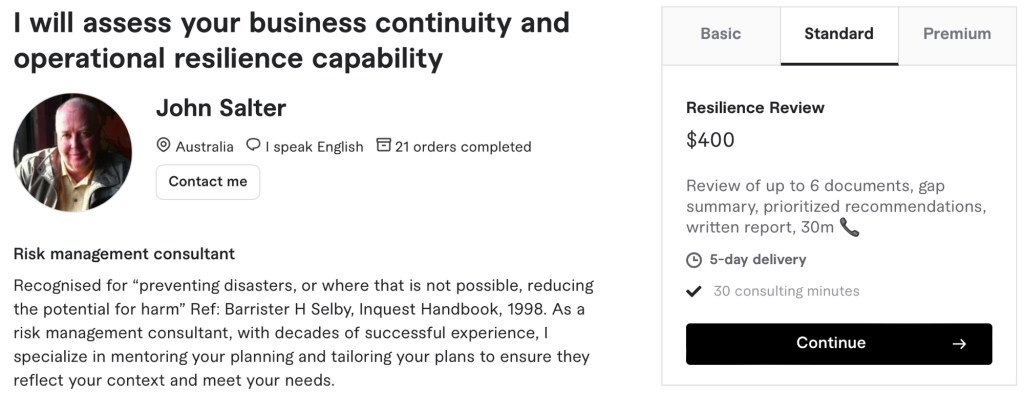
- Standard Continuity & Resilience Review
Review Date: April 2026
Assessment Scope: 7 BCM Capability Domains
Executive Overview
This report synthesises findings from the Management Capability Assessment Report (provided to client) against the Business Continuity Evidence rubric.
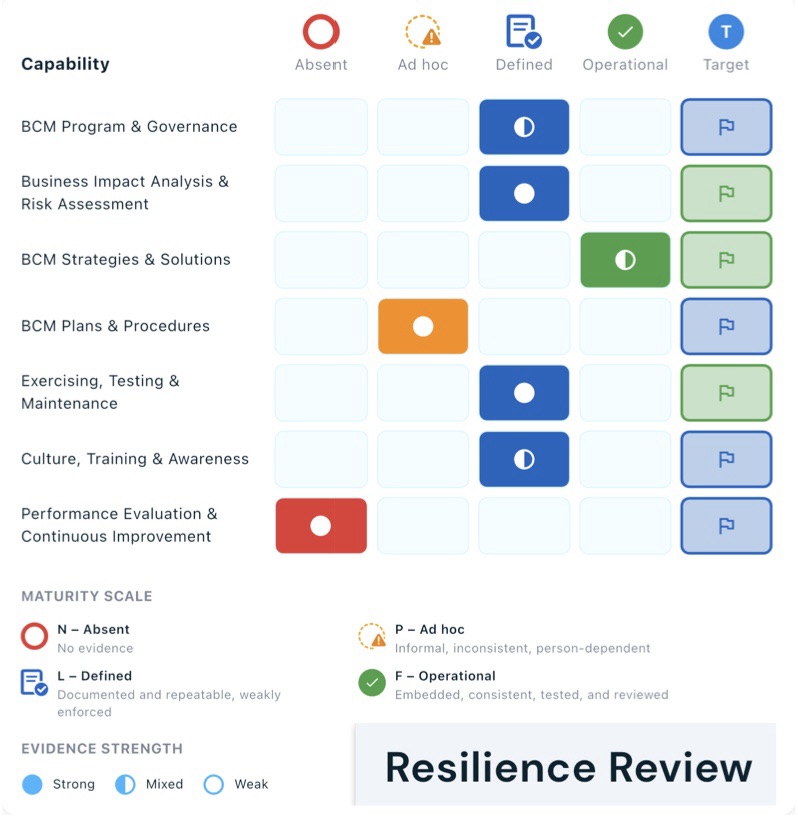
The assessment covers seven Business Continuity Management (BCM) domains rated on a four-point maturity scale:
N (Absent) → P (Ad hoc) → L (Defined) → F (Operational).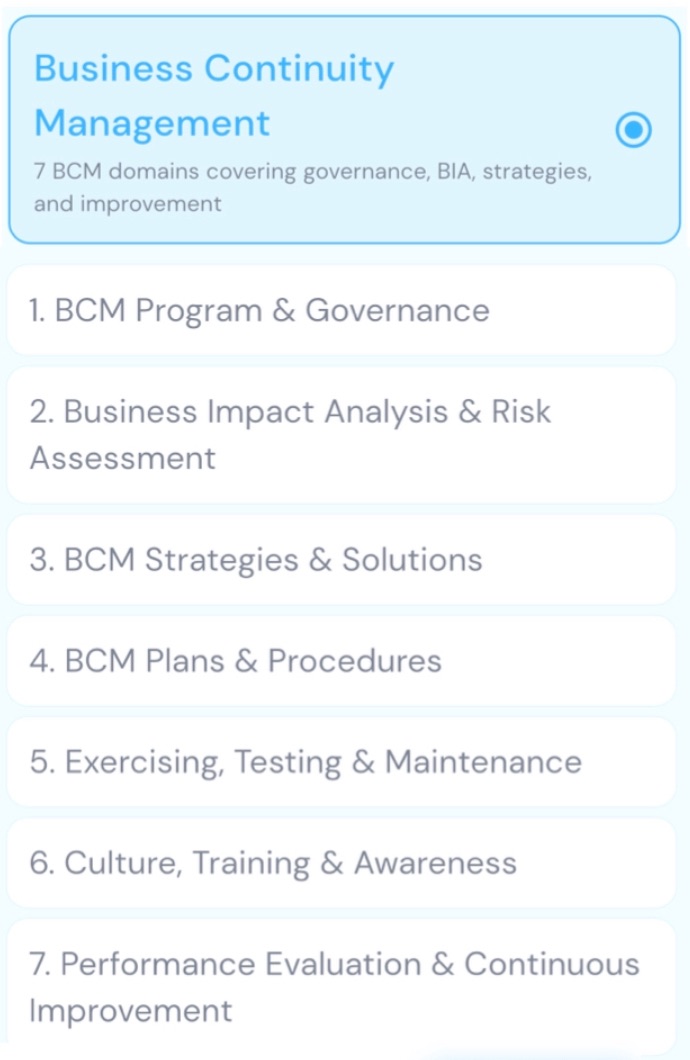
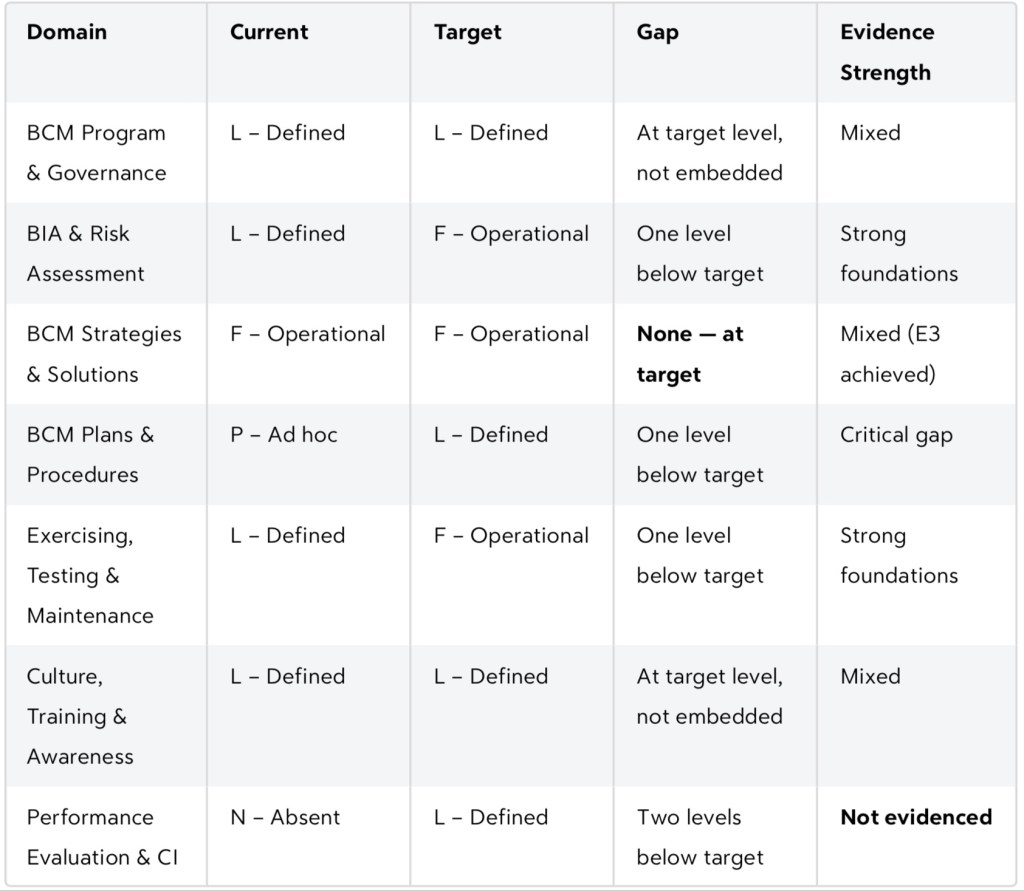
Of the seven domains, one has reached target maturity (BCM Strategies & Solutions at F/Operational), four sit at L/Defined — documented but weakly enforced (two of these four are at “acceptable” target levels — one remains Ad hoc (P), and one is entirely absent (N).
The consistent pattern across domains is strong foundational documentation (E1) and partial operational effectiveness (E2), but a near-universal failure to embed capability into routine organisational life (E3). Addressing the E3 gap is the single highest-leverage improvement available.
Maturity Snapshot
Strengths
BCM Strategies & Solutions — Only Fully Operational Domain
This is the standout strength of the current programme. All three evidence criteria (E1, E2, E3) are met: a defined approach for selecting strategies exists, those strategies are validated against agreed RTOs/RPOs, and they are aligned with risk appetite, IT DR architecture, supplier contracts, and broader resilience planning. This domain is at target and demonstrates that embedded, cross-functional BCM capability is achievable within this organisation.
Sound Governance and BIA Foundations
In five of seven domains, E1 (the existence of defined artefacts) is confirmed. The organisation has an approved BCM policy, documented governance structure, active oversight by governance bodies, a rigorous BIA and risk assessment methodology, and an exercising program that meaningfully validates assumptions and recovery timelines. These are genuine foundations — the infrastructure exists to advance maturity; what is largely missing is the discipline to use it routinely and the mechanisms to improve it over time.
Competent People and Active Exercising
Culture, Training & Awareness shows that defined BCM roles exist with competency profiles, training has been delivered, and people can demonstrate role competence during exercises. Similarly, the exercising program is more than pro forma — exercises validate decision-making, coordination, and recovery timelines against RTOs/RPOs. These are meaningful achievements that provide a platform for embedding and continuous improvement.
Key Gaps
Gap 1 — Performance Evaluation & Continuous Improvement is Completely Absent
This is the most critical gap in the programme. No mechanisms exist for monitoring, measuring, or evaluating BCM performance. There are no KPIs, no internal audit or review process, and no corrective action framework. The consequence is that the organisation cannot determine whether its BCM programme is actually working, cannot demonstrate compliance or assurance, and cannot close the loop on lessons from exercises or incidents. Without this domain, all other improvement efforts are largely self-referential.
Gap 2 — BCM Plans & Procedures Remain Ad hoc
Plans and procedures are the operational core of any BCM programme and represent the most significant performance risk. While a framework for plan development exists (E1 answered YES), plans are not clear, actionable, or usable under realistic time pressure (E2 answered NO), and there is no evidence they are current, accessible, or actually referenced during incidents or exercises (E3 answered NO). In a real disruption, teams would be working from documents that may be out of date, hard to find, and written for readers rather than responders.
Gap 3 — Systemic Failure at E3 (Embedded) Across All Domains
Six of seven domains fail at the E3 level. This reveals a structural pattern: the organisation has successfully documented its BCM arrangements and can perform them when prompted (exercises, audits), but has not yet woven BCM into the routine operating rhythm of the business. Specifically:
- Governance is not integrated into ERM, strategy, or management review cycles
- BIA outputs are not kept current and do not actively drive investment or prioritisation decisions
- Lessons from exercises are not tracked, assigned ownership, or used to update BIAs, plans, or training materials
- Culture and awareness are not sustained through onboarding, leadership messaging, or performance frameworks
This E3 gap means that BCM capability is fragile — dependent on motivated individuals and scheduled activities rather than organisational habit.
Recommended Actions
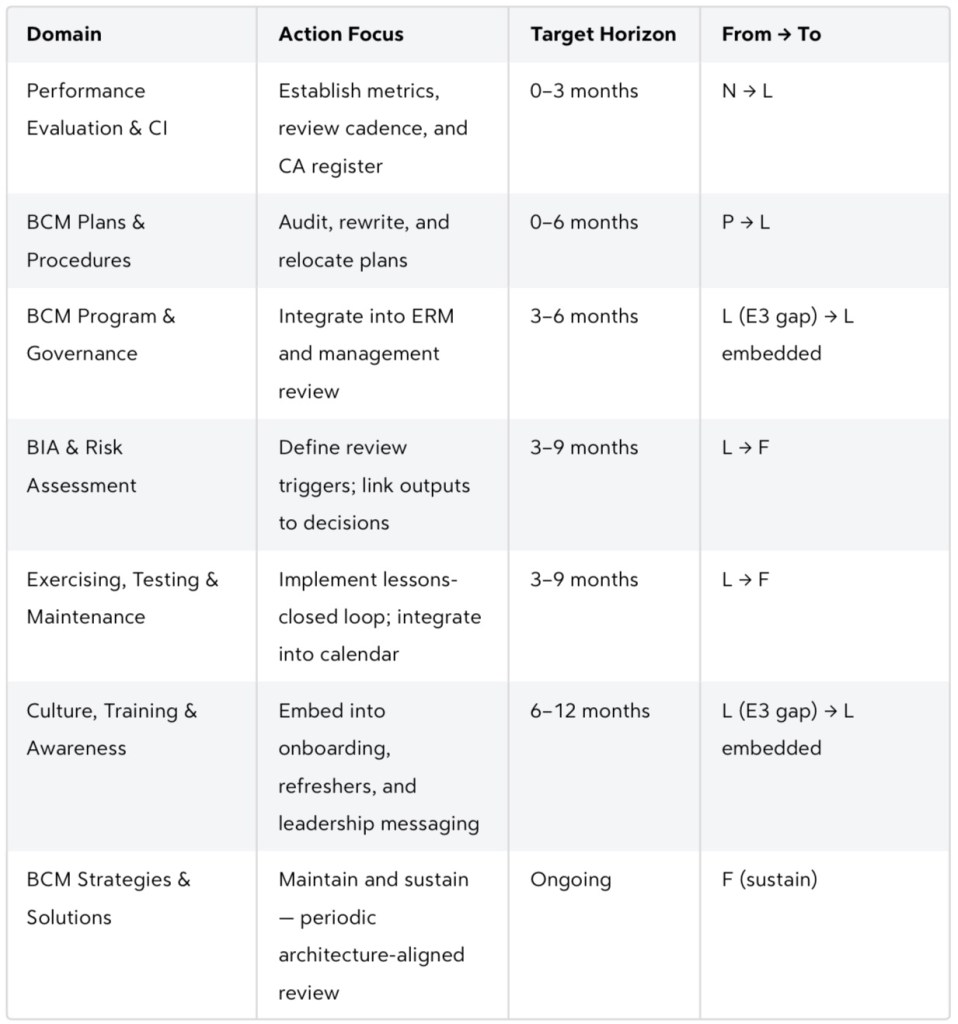
Actions are sequenced by impact and urgency.
Priority 1 — Establish Performance Evaluation & CI (Immediate)
Target: N → L within 90 days
- Define a BCM metrics set covering plan currency, BIA coverage, exercise completion, training rates, and lessons-to-closure cycle time
- Assign a BCM performance owner accountable for regular reporting
- Establish a quarterly BCM management review on a fixed calendar (can be nested within existing ERM or risk committee meetings)
- Create a simple corrective action register (even a shared spreadsheet) to track findings from exercises, audits, and incidents through to closure
This single action unlocks the ability to govern, improve, and demonstrate BCM effectiveness across all other domains.
Priority 2 — Overhaul BCM Plans & Procedures (0–6 Months)
Target: P → L
- Audit all current plans against a minimum content standard: triggers, decision points, role-based checklists, contact lists, and dependencies
- Rewrite plans to be action-oriented and usable under time pressure — short, structured, and role-specific rather than narrative documents
- Establish a single authoritative storage location with offline/alternate access, and verify plans are referenced in relevant contracts and operational procedures
- Set a version-control and review cycle triggered by organisational change events, not just calendar dates
Priority 3 — Close E3 Gaps Through Routine Integration (3–12 Months)
Governance integration: Add BCM as a standing item on ERM and management review agendas. Include BCM status in board reporting at least annually. Incorporate BCM accountabilities into relevant executive KPIs or performance discussions.
BIA and risk currency: Establish a defined review trigger framework — annual full reviews plus event-driven updates (major change programmes, new suppliers, restructuring). Ensure BIA outputs are visibly referenced in investment proposals and project business cases.
Lessons-learned loop: After every exercise, appoint an owner for each lesson identified with a due date and track it through the corrective action register. Report lesson closure rates as a BCM KPI. This creates the feedback loop that advances Exercising, Testing & Maintenance from L to F.
Cultural embedding: Integrate BCM awareness into the onboarding programme for all staff and role-specific induction for BCM plan owners. Schedule annual refreshers tied to the exercise calendar. Ask senior leaders to include a brief BCM message at team meetings or all-staff communications following exercises or incidents.
Domain Improvement Roadmap
Conclusion
The organisation has built real BCM capability, especially in strategies and governance, and the BIA and exercising foundations are genuinely sound. The programme is not starting from scratch. The three actions that will generate the most improvement in the shortest time are: establishing a Performance Evaluation framework, making plans usable in an actual emergency, and creating a formal lessons-learned loop from exercises. Together, these would lift the overall maturity score substantially and address the structural E3 gap that currently limits the organisation’s confidence in its ability to respond and recover when it matters.
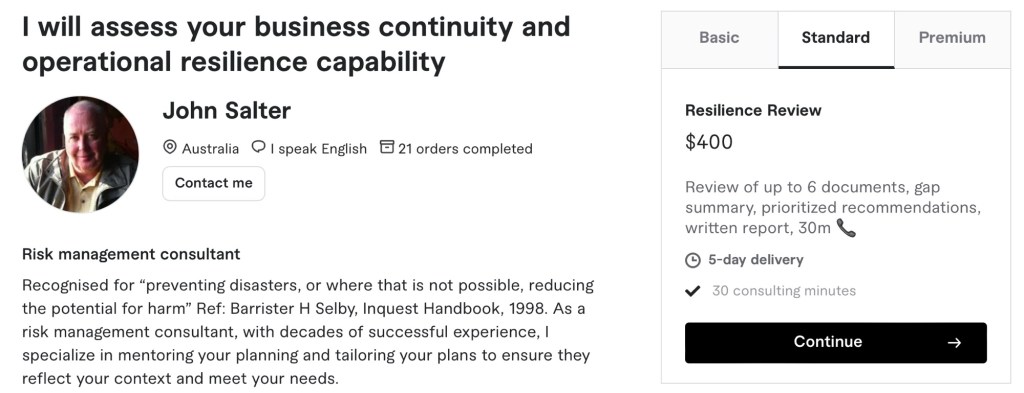
The Report (above) was an output provided in a “Standard” Gig
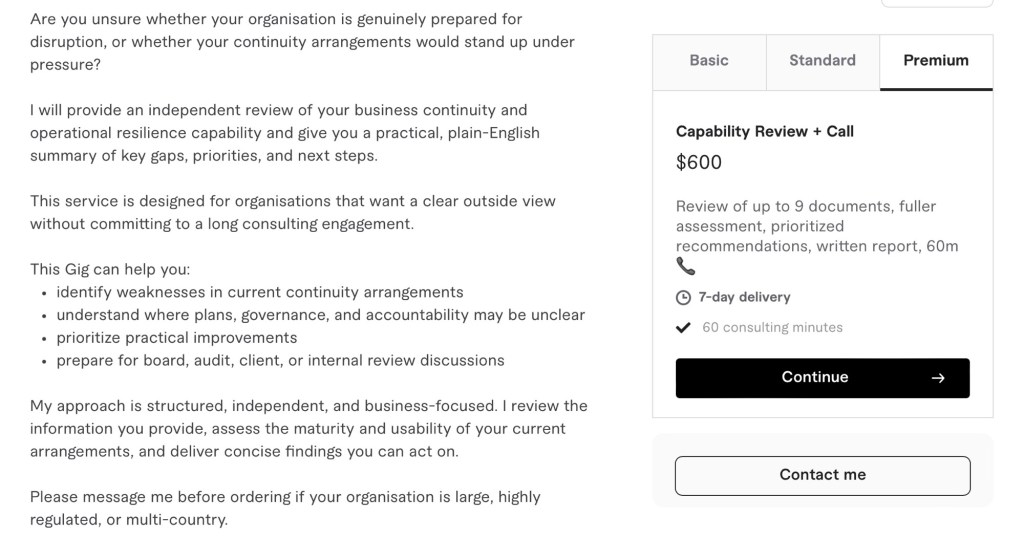
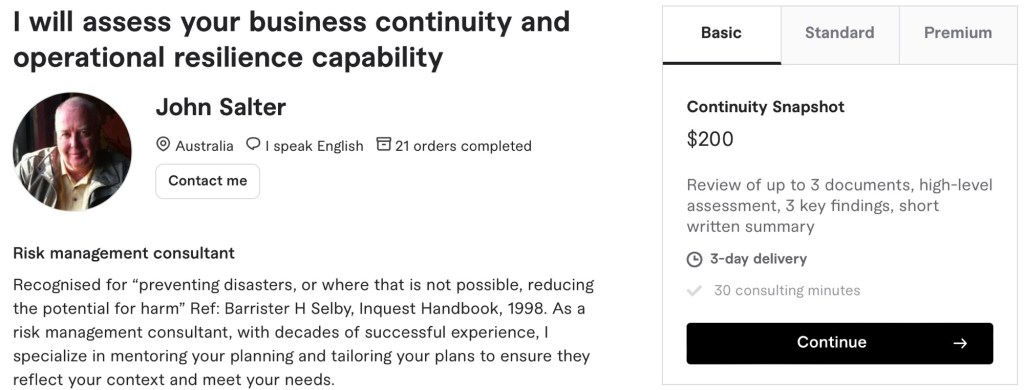
Are you unsure whether your organisation is genuinely prepared for disruption, or whether your continuity arrangements would stand up under pressure?
I will provide an independent review of your business continuity and operational resilience capability and give you a practical, plain-English summary of key gaps, priorities, and next steps.
This service is designed for organisations that want a clear outside view without committing to a long consulting engagement.
This Gig can help you:
– identify weaknesses in current continuity arrangements
– understand where plans, governance, and accountability may be unclear
– prioritise practical improvements
– prepare for board, audit, client, or internal review discussions
My approach is structured, independent, and business-focused. I review the information you provide, assess the maturity and usability of your current arrangements, and deliver concise findings you can act on.
Please message me before ordering if your organisation is large, highly regulated, or multi-country.
Frequently, Asked Questions
1. What kinds of organisations is this Gig for?
This Gig is best suited to small and mid-sized organisations that want an independent view of their business continuity or operational resilience capability.
2. What will you review?
I can review continuity plans, crisis management documents, incident response material, governance documents, policies, risk material, and related supporting information.
2b What electronic files, PDFs do you want from us?
Please consider the Download above including any from this BCM evidence set: policy & framework, risk register with BCM risks and latest assessment, approved BIAs, strategies and BCPs per critical area, crisis/incident plan with contacts, recent exercise and incident review reports, latest BCM audit and management review.
2c Can I have more documents considered in any package?
Yes, additional documents can be included at $50 per document.
3. What do I receive?
Depending on the package, you will receive a concise written summary or report with findings, gaps, and practical recommendations. Plus a phone conversation (package variations).
4. Is this the same as ISO 22301
certification advice?
Not exactly. This Gig provides an independent capability review and practical recommendations. It is not a formal certification audit.
5. Do you write full business continuity plans?
No. This Gig focuses on assessment and advice. If you need plan development or a larger consulting engagement, message me first.
6. Can you review existing documents only?
Yes. This Gig works well if you already have plans or policies and want an independent external review.
7. Do you need access to confidential information?
Only the information needed for the review. Please remove highly sensitive material where possible before sharing.
8. Can you work with regulated or complex organisations?
Yes, but please message me before ordering so I can confirm fit, scope, and timing.
- A necessary and sufficient BCM/resilience “evidence set”
When commissioned to review a client’s continuity and resilience capabilities I am nearly always asked – “What documentation do you need to review?” You can reflect on my response below:
“Minimum Viable” set to request client to consider
BCM minimum evidence set: policy & framework, risk register with BCM risks and latest assessment, approved BIAs, strategies and BCPs per critical area, crisis/incident plan with contacts, recent exercise and incident review reports, latest BCM audit and management review.
- BCM policy and framework document.
- Current enterprise risk register with BCM-relevant risks highlighted and the latest BCM risk assessment.
- Completed and approved BIAs for all critical business units or services.
- Approved continuity strategies and at least one current BCP per critical area.
- Crisis/incident management plan with contact lists.
- Last 2–3 exercise reports and action logs.
- Last post-incident review (if any major event in last 2–3 years).
- Latest BCM-related audit report and management review minutes.
- Evidence of document control (register or repository view) and training/awareness records.
A minimal but robust suite to test for in any client can be grouped into governance, analysis, solution design, implementation, and assurance.
1. Governance and Policy
- Business continuity / resilience policy (scope, objectives, principles, authority, review cycle).[2]
- BCM program charter or framework, showing integration with ERM and other ISO-style management systems.[3][1]
- Defined roles and responsibilities (e.g. BCM sponsor, coordinator, plan owners, incident manager, crisis team).[4][5]
- Governance bodies and oversight records: steering committee / risk committee ToR and minutes where BCM is discussed.[6]
- Regulatory or contractual requirement register for continuity/resilience (where applicable, e.g. APRA CPS 232, ASX rules).[2]
2. Risk and Impact Foundations
- Enterprise or BCM-specific risk assessment identifying disruption scenarios, likelihood/impact, current controls and gaps.[8][3]
- Documented business impact analysis at appropriate levels (process/service/function) with: critical activities, MTPD/MAO, RTOs/RPOs, resource dependencies, peak periods, and upstream/downstream impacts.[10][3]
- Clear linkage: risk assessment and BIA feeding into continuity strategies and priorities (traceable in documentation sets).[2][3]
3. Strategies, Plans and Supporting Data
- Documented continuity strategies (e.g. alternate site, remote work, manual workarounds, stockpiles, supplier redundancy) with rationale from BIA and risk assessment.[2][8]
- One or more business continuity plans that consolidate:
- Incident detection and declaration criteria.
- Activation and escalation procedures.
- Structure and roles of crisis/BC teams.
- Communication strategy (internal, external, regulators, media, key stakeholders).[5][9]
- Supporting playbooks/procedures where critical (IT disaster recovery, facilities, cyber, critical supply-chain, people surge/relocation).[5][10]
- Up-to-date contact lists (staff, executives, crisis team, key suppliers, critical customers, emergency services, regulators) with access arrangements on and off site.[12][9]
- Essential reference
- Register of critical processes, applications, sites, assets and their RTO/RPO.[3][4]
- Records of key contracts, licences, insurances, and property documents, plus how they are accessed during disruption.[13][11]
4. Implementation, Training and Communication
- Implementation plan or roadmap for BCM capabilities, mapped to actions, owners and dates.[10][3]
- Training and awareness material, attendance records, and role-specific briefing for incident/crisis team members.[3]
- Evidence of staff communication about continuity arrangements (intranet pages, newsletters, briefings, onboarding content).[5]
5. Exercising, Review and Continuous Improvement
- Exercise/test strategy and schedule (covering a mix of tabletop, simulations, technical recovery tests).[7][8]
- Exercise plans/scripts and post-exercise reports including outcomes, issues, and agreed improvements.[14][8]
- Post-incident reviews / after-action reports following real disruptions, with lessons learned and tracked actions.[3][8]
- Documented corrective actions and improvements log linking to exercises, incidents, audits and management reviews.[7][8]
- Internal or external BCM audits or reviews, including scope, findings, and follow-up verification.[6][14]
- Periodic management review of the BCM/resilience program (agenda, pack and minutes), showing assessment of performance, changes in context, and resource decisions.[3][2]
6. Document Management and Accessibility
- Documented classification of BCM documents (policies, BIAs, plans, playbooks, records) and ownership.[6][14]
- Version control and review history for key documents (policy, framework, BIAs, plans, strategies).[14]
- Evidence of secure, resilient storage and access arrangements for continuity documents (e.g. ERM/BCM tool, shared drive with offline/alternate access).[12][14][6]
Sources
[1] Business Continuity Management and Resilience Guidelines https://policies.uow.edu.au/document/view-current.php?id=218&version=1
[2] Prudential Standard CPS 232 Business Continuity Management https://www.apra.gov.au/sites/default/files/Prudential-Standard-CPS-232-Business-Continuity-Management-(July-2017).pdf
[3] Guide to business continuity & resilience https://www.protiviti.com/sites/default/files/2022-11/guide-to-business-continuity-and-resilience-fifth-edition-protiviti_GLOBAL.pdf
[4] Guidance Note 10 – Business Continuity and Disaster Recovery https://www.asx.com.au/documents/rules/asx_clear_guidance_note_10.pdf
[5] SECTION 3: APPENDICES CHECKLISTS AND CONTROL … https://pqc.icai.org/assets/ISACourse2.0DVD/7.0_Business_Continuity_Management/Section_3_Appendices/Section_3_Checklist_For_BCP_Audit.pdf
[6] Business Continuity Review | vic.gov.au – Victorian Government https://www.vic.gov.au/business-continuity-review
[7] [doc] EN_BCP-Check-list.docx https://preparecenter.org/wp-content/uploads/2020/05/EN_BCP-Check-list.docx
[8] How to Conduct a Business Continuity Risk Assessment – V-Comply https://www.v-comply.com/blog/business-continuity-risk-assessment/
[9] AFP National Guideline on business continuity management https://www.afp.gov.au/sites/default/files/2024-02/AFP-National-Guideline-on-business-continuity-management.pdf
[10] Business Continuity Plan Based on Risk Assessment https://riskledger.com/support/framework/h/10
[11] How to Create a Business Continuity Plan https://www.qbe.com/au/news/how-to-create-a-business-continuity-plan
[12] business-continuity-plan-template.docx https://www.publications.qld.gov.au/dataset/05765d5a-91b3-45fd-af43-699ede65dd8a/resource/63f7d2dc-0f40-4abb-b75f-7e6acfeae8f3/download/business-continuity-plan-template.docx
[13] How to plan for a disaster | Not-for-profit … https://www.nfplaw.org.au/free-resources/disasters/governance/plan
[14] Business Continuity Plan Review Checklist [free pdf] – POPProbe https://www.popprobe.com/checklist-library/emergency/natural-disaster/b26a-eme-business-continuity-plan-review-checklist
[15] Prepare for the unexpected – Build a Business Continuity Plan https://www.smallbusiness.nsw.gov.au/sites/default/files/2023-11/16370_SBC%20Prepare%20for%20the%20unexpected%20ACCESSIBLE_0.pdf
- Necessary and Sufficient Evidence (Consolidated Framework)
For each domain, “necessary and sufficient” evidence means: the minimum concrete artefacts and observations that prove the criterion is in place (E1), enabled (E2), and working in practice (E3).
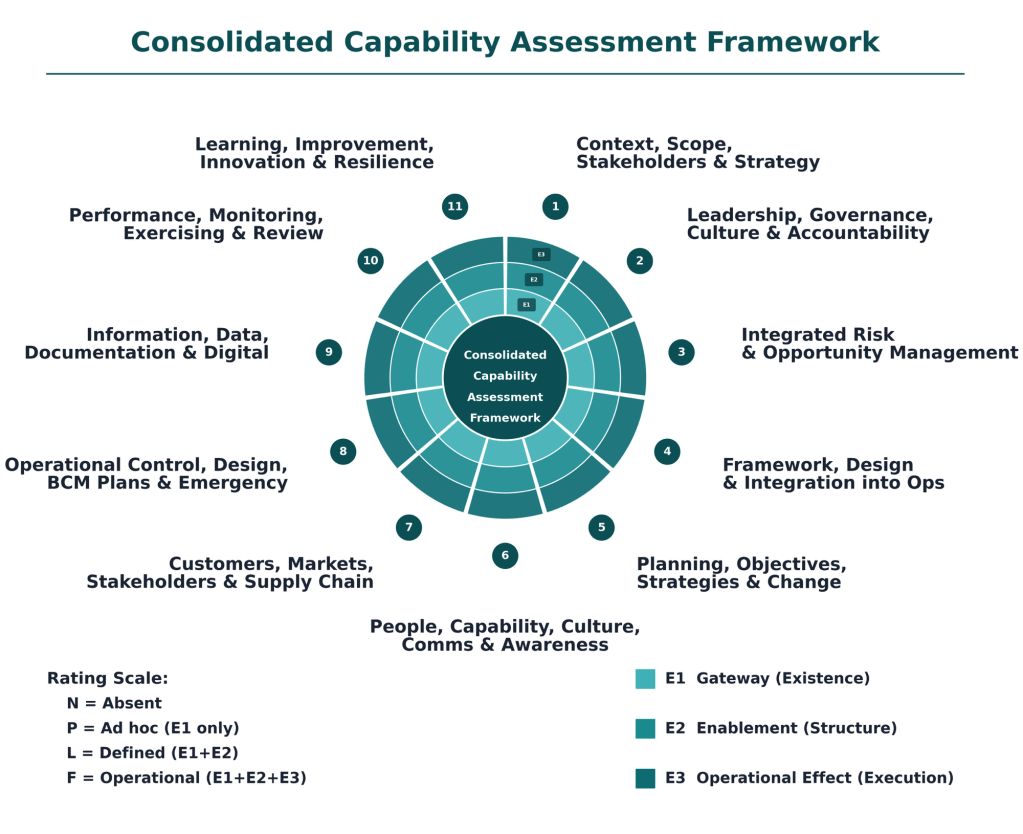
Below is a concise, practical set of examples.
1. Context, Scope, Stakeholders & Strategy
- E1 – Gateway (Existence)
- Approved procedure for context and stakeholder analysis covering QMS/EMS/Risk/BCM.
- Last completed context analysis (PESTLE, SWOT, similar) and stakeholder map.
- Documented scope statements for QMS/EMS/Risk/BCM and current strategic objectives set/approved.[1]
- E2 – Enablement (Structure)
- Version‑controlled context and stakeholder analyses stored in a defined repository, with review dates and owners.
- Objective register linking each objective to context/stakeholder drivers, with owners, measures, and targets.
- Visual or tabular mapping showing traceability: context & stakeholders → scope → objectives.[1]
- E3 – Operational Effect (Execution)
- Business cases, initiative charters, or portfolio papers explicitly referencing context/stakeholder insights and disruption scenarios.
- Risk and continuity investment decisions where disruption analysis or BIA inputs changed priorities or options.
- Steering/portfolio committee minutes showing strategic objectives used to approve, defer, or stop initiatives.[1]
2. Leadership, Governance, Culture & Accountability
- E1 – Gateway
- Approved, current policies for Quality, Environment, Risk, BCM.
- Governance structure document (e.g., RACI, terms of reference) defining roles, committees, and escalation paths.
- Board/Executive‑approved risk appetite statement or equivalent criteria.[1]
- E2 – Enablement
- Forward calendar and minutes of regular Q/E/R/BCM governance forums showing leader attendance.
- Resource plans or budgets explicitly allocating people/funding to these frameworks.
- Leadership communications (town halls, videos, emails) and recognition mechanisms promoting an open, learning culture.[1]
- E3 – Operational Effect
- Decision records where risk, quality, environmental or BCM information materially changed direction or conditions.
- Issue and action logs showing tracking, ownership, due dates, and closure of audits, incidents, and nonconformities.
- Observed leadership behaviours (e.g., walk‑throughs, safety/environment dialogues) consistent with stated policies and values.[1]
3. Integrated Risk & Opportunity Management
- E1 – Gateway
- Enterprise risk management procedure including risk criteria, treatment, and explicit BIA/continuity risk assessment method.
- Standard templates for risk registers and BIA (critical activities, RTOs, RPOs).
- Planning guidance that requires documenting opportunities as well as risks.[1]
- E2 – Enablement
- Consolidated risk registers covering strategic, operational, financial, environmental, and continuity risks, with owners and ratings.
- Completed BIA documentation for in‑scope services with current RTO/RPO, dependencies, and last review date.
- Evidence of periodic reviews updating risk and opportunity entries when services, technology, or context change.[1]
- E3 – Operational Effect
- Prioritised risk treatment plans and continuity strategies that clearly reference underlying risk ratings and BIA outputs.
- Investment, project or resource‑allocation decisions that explicitly follow risk and opportunity evaluations.
- Records of accepted, avoided, transferred, and treated risks with rationale tied to risk appetite.[1]
4. Framework, Design & Integration into Operations
- E1 – Gateway
- Integrated management framework document describing QMS/EMS/Risk/BCM processes and interfaces.
- Map showing integration points between framework processes and core operational and project processes.
- Defined project/initiative governance and delivery framework (stage gates, roles, decision rights).[1]
- E2 – Enablement
- Process documentation and templates embedding Q/E/R/BCM requirements (e.g., risk sections, environmental checks).
- Training records showing operational and project teams briefed on the integrated framework.
- Configured tools/workflows (e.g., PPM, ERP, ticketing) enforcing required checkpoints and approvals.[1]
- E3 – Operational Effect
- Samples of projects delivered following defined stage‑gates, with required framework artefacts present.
- Operational records (change requests, incident handling, service design) showing consistent use of the integrated processes.
- Findings from reviews or audits where deviations were detected, corrected, and led to updates in processes or training.[1]
5. Planning, Objectives, Strategies & Change
- E1 – Gateway
- Documented process for setting Q/E/R/BCM objectives and action plans, including risk/opportunity assessment.
- Methodology for developing continuity and recovery strategies (e.g., alternate site, manual workaround, supplier arrangements).
- Change management procedure requiring assessment of risk, continuity, and environmental impacts.[1]
- E2 – Enablement
- Objective and action plan register with targets, timelines, responsibilities, and required resources.
- Documented continuity and recovery strategies tested for feasibility (e.g., technical tests, supplier confirmations).
- Change templates/forms with mandatory sections for risk, continuity, and environmental assessment.[1]
- E3 – Operational Effect
- Budget and portfolio decisions demonstrably aligned to agreed objectives and risk‑based priorities.
- Examples where changes were modified, delayed, or rejected due to risk/continuity/environmental assessment outcomes.
- Procurement, facilities, IT, and workforce plans explicitly guided by continuity strategies (e.g., dual suppliers, resilient networks).[1]
6. People, Capability, Culture, Communication & Awareness
- E1 – Gateway
- Role profiles or competency matrices specifying requirements for BCM, Risk, QMS, EMS roles.
- Training and awareness framework for Q/E/R/BCM (curriculum, frequency, target audiences).
- Defined communication plan and channels (e.g., intranet, alerts, briefings) with owners.[1]
- E2 – Enablement
- Training records (completion data, refresher schedule) for staff in key and general roles.
- Knowledge repositories (wikis, guides, playbooks) capturing organisational knowledge for these disciplines.
- Evidence that messages (e.g., campaigns, tooltips, dashboards) reach intended audiences in a timely, understandable way.[1]
- E3 – Operational Effect
- Observed competence in exercises, incidents, audits, and daily operations (e.g., correct use of risk and BCM tools).
- Survey or interview results showing risk and BCM awareness outside specialist teams.
- Behavioural evidence (e.g., proactive risk raising, near‑miss reporting, environmental good practices) aligned with desired culture.[1]
7. Customers, Markets, Stakeholders & Supply Chain
- E1 – Gateway
- Defined processes for capturing customer/stakeholder requirements and feedback (VOC, complaints, surveys).
- Supplier/partner onboarding and management procedures including Q/E/R/BCM expectations.
- Documented continuity and environmental obligations with key suppliers in contracts or SLAs.[1]
- E2 – Enablement
- Regular customer and supplier performance reports including quality, environmental, risk, and continuity indicators.
- Controls for critical suppliers (SLAs with penalties, audit programs, contingency clauses).
- Evidence of market, stakeholder, and supply‑chain insights being fed into planning and risk assessments.[1]
- E3 – Operational Effect
- Records where customer/stakeholder feedback triggered specific improvements or control changes.
- Documented mitigation actions for critical supplier risks (diversification, alternate suppliers, stockpiles).
- Joint initiatives or co‑designed improvements with key customers/suppliers that measurably improved performance or resilience.[1]
8. Operational Control, Design, BCM Plans & Emergency Response
- E1 – Gateway
- Documented process maps and work instructions for key products/services and critical activities.
- BCM plans and emergency response procedures for relevant scenarios and locations.
- Defined design and development process (where applicable) with control points and verification steps.[1]
- E2 – Enablement
- Role‑based, accessible versions of procedures and BCM/emergency plans (e.g., mobile, control‑room copies).
- Contracts or operational procedures referencing relevant BCM and emergency requirements and triggers.
- Clear assignment of incident/BCM roles, with criteria for activating and escalating plans.[1]
- E3 – Operational Effect
- Incident and exercise records showing plans and procedures were followed and effective.
- Evidence of operational and emergency controls preventing or mitigating key risks (KPIs, loss data, safety/environmental metrics).
- Post‑incident/exercise reviews resulting in updates to operational controls, BCM plans, and training.[1]
9. Information, Data, Documentation & Digital
- E1 – Gateway
- Documented information management procedure (creation, approval, retention, access) specific to Q/E/R/BCM.
- Defined data quality standards and ownership for critical data sets.
- Inventory of digital tools and systems supporting Q/E/R/BCM, with roles and responsibilities.[1]
- E2 – Enablement
- Evidence documents and records are reviewed, approved, version‑controlled, and easily retrievable.
- Configured systems enforcing standard fields, workflows, and reports for Q/E/R/BCM data capture.
- Information security and integrity controls (access profiles, backups, audit logs) for critical information.[1]
- E3 – Operational Effect
- Examples where Q/E/R/BCM data and reports are used in operational and strategic decisions.
- Trend analyses and dashboards used to identify issues, hotspots, and improvement needs.
- Logs of data/document issues and corrections, including root cause fixes to prevent recurrence.[1]
10. Performance Measurement, Monitoring, Exercising & Review
- E1 – Gateway
- Defined KPI set and targets for quality, environmental, risk, and BCM performance.
- Documented internal audit and management review program.
- BCM exercising and testing program document specifying objectives, scope, and frequency.[1]
- E2 – Enablement
- Evidence that monitoring, audits, reviews, and exercises occur per plan, with documented outputs and actions.
- Analysis reports that go beyond compliance to examine trends, causes, and exposure.
- Action registers assigning owners and due dates to findings and exercise outcomes.[1]
- E3 – Operational Effect
- Traceable examples where monitoring/audit results led to changes in controls, priorities, or strategies.
- Exercise reports demonstrating realistic scenarios, identified gaps, and resulting updates to BIA, strategies, and plans.
- Management review minutes showing use of results to steer direction, investment, and risk posture.[1]
11. Learning, Improvement, Innovation & Resilience Evolution
- E1 – Gateway
- Procedure for capturing incidents, nonconformities, near misses, and lessons, across Q/E/R/BCM.
- Mechanisms for collecting improvement and innovation ideas (campaigns, suggestion schemes, retrospectives).
- Defined root cause analysis and improvement planning method and templates.[1]
- E2 – Enablement
- Register/portfolio of improvement and innovation initiatives with prioritisation criteria.
- Investigation records showing consistent use of root cause methods where thresholds are met.
- Action tracking system with ownership, deadlines, and status for improvement items.[1]
- E3 – Operational Effect
- Trend data showing reduction in repeat incidents, nonconformities, or near misses in targeted areas.
- Case examples where specific improvements measurably enhanced risk, quality, environmental, or continuity outcomes.
- Evidence that lessons and insights feed back into strategy, frameworks, and capability building (e.g., revised standards, new training).[1]
Sources
[1] Consolidated-Capability-Assessment-Framework-Discussion.pdf - E1 – Gateway (Existence)
- “Necessary and Sufficient” Resilience Evidence
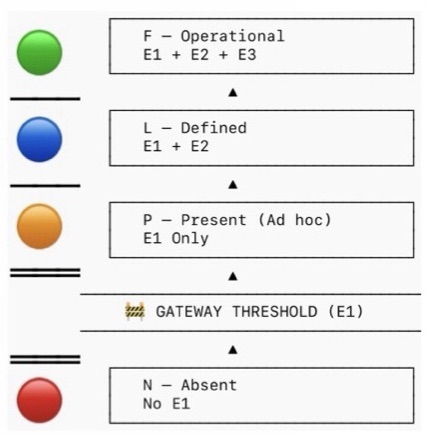
You can treat “necessary and sufficient” at each level as
(a) existence of defined artefacts (E1),
(b) evidence of use and quality (E2), and
(c) evidence that use is routine, linked to other systems, and self‑reinforcing (E3) across all seven domains.[1]
Below are concise criteria you can use as an assessment rubric.
1. BCM Program & Governance
E1 – Established (gateway)
Necessary and sufficient evidence:[1]- Approved BCM policy stating objectives, scope, and principles.
- Documented roles, responsibilities, and authorities for BCM (incl. executive sponsor and owner).
- Defined governance structure (e.g., steering committee, risk/BCM forum) with ToR and meeting cadence.
- BCM included in organisational policy hierarchy and referenced in key management system documents.
E2 – Effective
Necessary and sufficient evidence:[1]- Governance body meeting records showing BCM on the agenda, decisions, and follow‑up actions (priorities, risk acceptance, funding).
- Documented approval of BCM plans, strategies, and key assumptions by governance.
- Evidence of resource allocation decisions for BCM (budget lines, FTE, tools).
- Escalation and issue‑resolution records demonstrating governance intervention on BCM issues.
E3 – Embedded
Necessary and sufficient evidence:[1]- BCM explicitly integrated into ERM, strategy, and investment processes (e.g., BCM inputs in risk registers and business cases).
- BCM status incorporated into management review, board reporting, and audit/assurance programs.
- BCM accountabilities in executive scorecards or KPIs, and reflected in performance discussions.
- Demonstrated use of BCM insights in strategic decisions (e.g., site selection, outsourcing, IT transformation).
2. BIA & Risk Assessment
E1 – Established (gateway)
Necessary and sufficient evidence:[1]- Documented BIA and continuity risk assessment methodology, including impact dimensions, scoring, RTO/RPO definitions, and approval.
- Standard templates and tools for BIAs and risk assessments.
- Defined scope and criteria for critical activities, applications, sites, and third parties.
- Assigned responsibilities and schedule for conducting and reviewing BIAs/assessments.
E2 – Effective
Necessary and sufficient evidence:[1]- Completed BIAs for in‑scope business units showing clear impact rationales, quantified impacts, and traceable RTO/RPO decisions.
- Risk assessments with documented causes, scenarios, likelihood, and controls leading to coherent risk ratings.
- Evidence that BIA and risk outputs are used in strategy choice (e.g., mapping RTOs to DR tiers, staffing, alternate sites).
- Sign‑off by accountable business owners and challenge/validation by BCM or risk specialists.
E3 – Embedded
Necessary and sufficient evidence:[1]- BIA and risk data maintained in a living register or system with defined review triggers (e.g., annual plus change‑driven updates).
- Evidence that updated BIA/risk outputs directly drive investment, prioritisation, and project decisions.
- Linkage between BIA/risk results and other disciplines (IT DR planning, vendor risk, crisis scenarios, insurance).
- Regular reporting of BIA and risk metrics/trends to governance and inclusion in audit and assurance scopes.
3. BCM Strategies & Solutions
E1 – Established (gateway)
Necessary and sufficient evidence:[1]- Documented organisational approach for selecting continuity/recovery strategies (e.g., tiers, patterns, cost–benefit criteria).
- Defined decision criteria linking strategies to RTO/RPO, risk appetite, and dependencies (people, facilities, IT, suppliers).
- Standard templates for documenting strategy options, assumptions, and decisions.
- Roles and approvals for endorsing BCM strategies.
E2 – Effective
Necessary and sufficient evidence:[1]- Strategy documents demonstrating realistic solutions mapped to agreed RTOs/RPOs and constraints.
- Technical and operational validation that strategies are feasible (e.g., DR design, capacity assessments, alternate site readiness).
- Evidence of trade‑off analysis and cost–benefit justification for chosen strategies.
- Sign‑off from affected stakeholders (IT, facilities, HR, suppliers, operations) confirming capability and responsibilities.
E3 – Embedded
Necessary and sufficient evidence:[1]- Clear alignment of BCM strategies with risk appetite, budgets, IT DR architecture roadmaps, and supplier contracts/SLAs.
- Integration of BCM strategies with broader resilience initiatives (e.g., cyber, supply chain, safety, crisis management).
- Periodic review of strategies tied to architecture, sourcing, and capital planning cycles.
- Evidence that major change programs routinely consider and update BCM strategies as part of their process.
4. BCM Plans & Procedures
E1 – Established (gateway)
Necessary and sufficient evidence:[1]- Documented organisational framework for plan types (crisis, business recovery, IT DR, site emergency, etc.) and their relationships.
- Standard templates, style guides, and minimum content requirements for BCM plans.
- Defined ownership, maintenance responsibilities, and review cycles for each plan.
- Formal approval process for plans.
E2 – Effective
Necessary and sufficient evidence:[1]- Plans that are concise, role‑based, and action‑oriented with clear triggers, decision points, and checklists.
- Inclusion of dependencies, workarounds, communication matrices, and contact lists verified as current.
- Evidence from exercises or incidents that plans could be followed under time pressure and enabled timely recovery.
- Feedback from users indicating plan usability and clarity, and resulting improvements.
E3 – Embedded
Necessary and sufficient evidence:[1]- Plans stored in accessible locations (including offline/alternate access) and referenced in operational procedures and contracts.
- Demonstrated use of plans during real incidents or exercises (logs, debriefs, post‑incident reports).
- Integration with other documentation sets (SOPs, IT runbooks, HR procedures, vendor playbooks).
- Routine plan updates triggered by organisational changes, system updates, or lessons learned, with version control.
5. Exercising, Testing & Maintenance
E1 – Established (gateway)
Necessary and sufficient evidence:[1]- Documented exercising/testing strategy and program with scope, objectives, frequency, and methods (table‑top, simulation, technical tests).
- Defined roles, responsibilities, and approval requirements for exercises and tests.
- Standard templates for scenarios, plans, evaluation, and reporting.
- A forward schedule or calendar of exercises and tests.
E2 – Effective
Necessary and sufficient evidence:[1]- Executed exercises that test key assumptions, decision‑making, escalation, and recovery timelines against RTOs/RPOs.
- Test and exercise reports capturing objectives, outcomes, issues, and quantitative/qualitative performance.
- Evidence that coordination across functions, sites, and suppliers has been exercised and evaluated.
- Documented comparison of actual recovery performance versus targets, with root‑cause analysis where not met.
E3 – Embedded
Necessary and sufficient evidence:[1]- Lessons identified captured in a central log with owners, due dates, and status tracking to closure.
- Evidence that lessons directly trigger updates to BIAs, strategies, plans, training, and technical configurations.
- Exercises integrated into business calendars (e.g., aligned to peak periods, change freezes, regulatory cycles).
- Continuous improvement themes visible over time (e.g., recurring issues reducing, maturity increasing in reports).
6. Culture, Training & Awareness
E1 – Established (gateway)
Necessary and sufficient evidence:[1]- Defined BCM roles (e.g., coordinators, plan owners, incident managers) with competency profiles.
- Organisational BCM training and awareness framework, including curricula for different role types.
- Training materials and awareness artifacts (e‑learning, slide decks, intranet content, posters, FAQs).
- Defined schedule and responsibility for delivering and maintaining training and awareness.
E2 – Effective
Necessary and sufficient evidence:[1]- Training records showing completion rates by role, with assessments or quizzes indicating competence.
- Evidence that participants can perform critical BCM tasks during exercises or incidents (observed behaviours, role performance).
- Feedback mechanisms (surveys, debriefs) indicating understanding of BCM responsibilities.
- Demonstrated engagement from leaders (sponsoring sessions, speaking at drills, messaging on BCM importance).
E3 – Embedded
Necessary and sufficient evidence:[1]- BCM awareness integrated into onboarding, role changes, and periodic refresher programs.
- Regular leadership communications referencing BCM and resilience as part of “how we do business”.
- BCM behaviours visible in day‑to‑day operations (e.g., staff raising resilience issues, using workarounds, updating call‑trees).
- BCM competence referenced in role descriptions, performance reviews, or professional development plans.
7. Performance Evaluation & Continuous Improvement
E1 – Established (gateway)
Necessary and sufficient evidence:[1]- Documented mechanisms for monitoring, measuring, and evaluating BCM (KPIs, KRIs, internal audits, management reviews).
- Defined BCM metrics set (e.g., BIA coverage, test performance, plan currency, training rates).
- Schedule and roles for BCM performance evaluations and reviews.
- Linkage to nonconformance/corrective action processes where they exist.
E2 – Effective
Necessary and sufficient evidence:[1]- Regular reports that identify meaningful gaps, trends, and systemic weaknesses (not just activity counts).
- Internal audits or reviews with documented findings, ratings, and recommendations related to BCM.
- Evidence that performance information is discussed by governance, with prioritised actions agreed.
- Analysis across incidents, tests, and metrics demonstrating insight into underlying causes, not just symptoms.
E3 – Embedded
Necessary and sufficient evidence:[1]- Corrective and improvement actions tracked through to closure with deadlines and accountability.
- Evidence that BCM evaluation outcomes influence management decisions, investment, and risk appetite discussions.
- BCM performance integrated into enterprise assurance maps and combined assurance reporting.
- Demonstrated year‑on‑year changes in capability, reflected in metrics, external feedback, or independent maturity assessments.
Reference Source
[1] Business-Continuity-Management-2.pdf