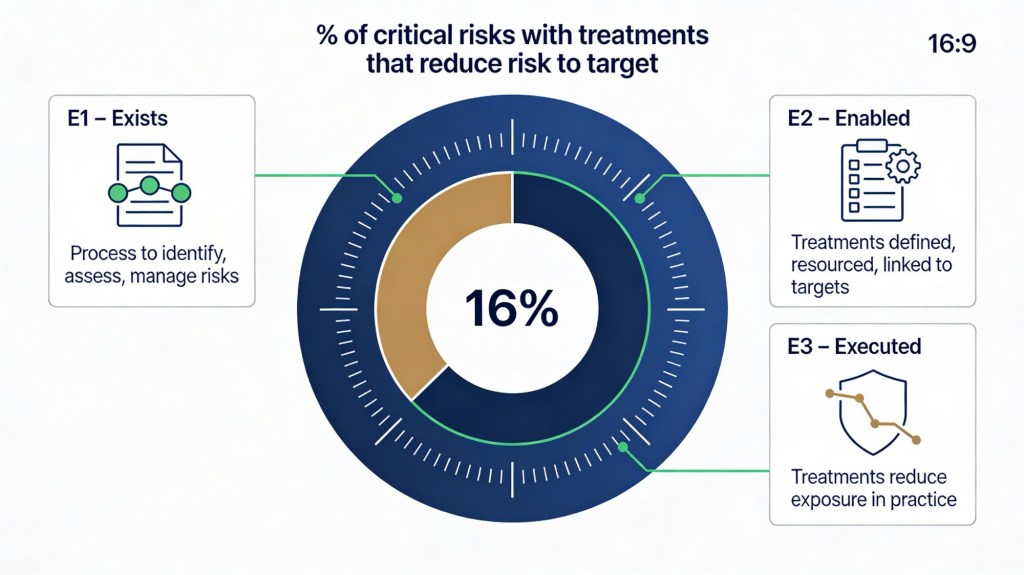
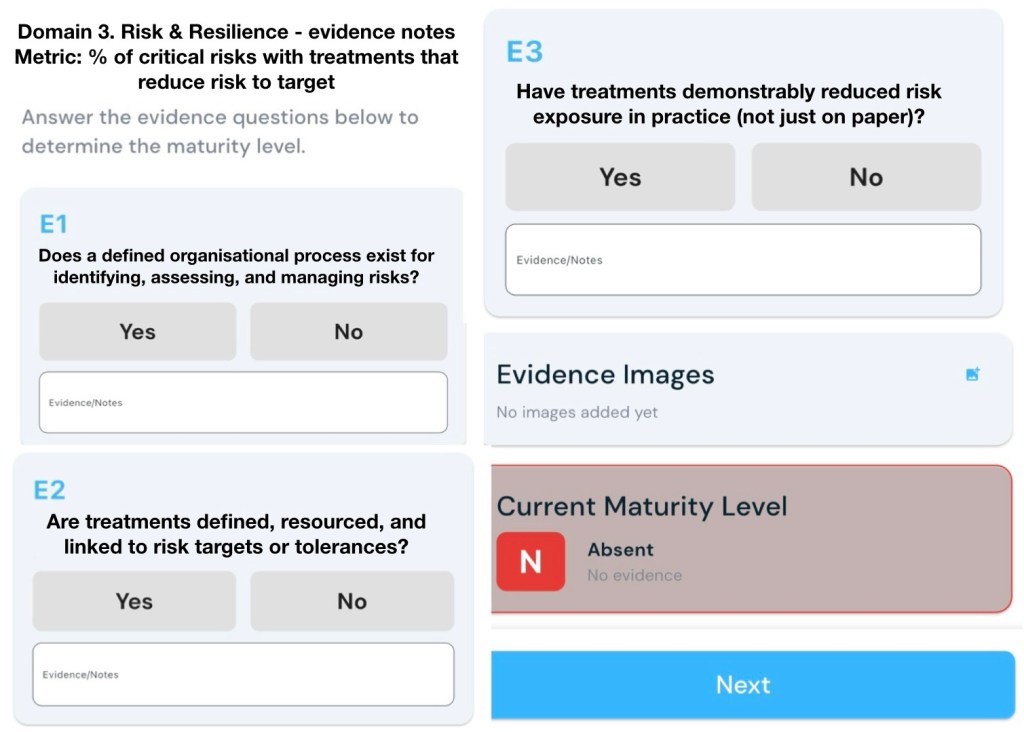
Metric: % of critical risks with treatments that reduce risk to target
E1 – Exists (Gateway Evidence)
Does a defined organisational process exist for identifying, assessing, and managing risks?
E2 – Enabled
Are treatments defined, resourced, and linked to risk targets or tolerances?
E3 – Executed
Have treatments demonstrably reduced risk exposure in practice (not just on paper)?
An assessment against this metric would look for clear evidence that:
- there is a defined, repeatable risk management process (E1),
- critical risks have specific, resourced treatments tied to risk appetite/tolerances (E2), and
- those treatments have actually reduced risk exposure in practice (E3).[1][2][3]
Below are examples of the kind of evidence and notes that would typically support each level.
E1 – Exists (Gateway Evidence)
Evidence that a defined organisational process exists for identifying, assessing, and managing risks.[4][1]
You would expect to see:
- Documented risk management framework and policy approved by the governing body, referencing standards such as ISO 31000 and describing objectives, scope, roles, and responsibilities.[2][4]
- A documented risk management process (e.g. procedure or toolkit) that clearly sets out steps: establish context, identify risks, analyse/assess, evaluate against criteria, treat, and monitor/review.[1][4]
- Defined risk categories, rating scales, and risk evaluation criteria (likelihood, consequence, and clear definitions of “critical” risk).[5][2]
- Evidence that the process is in use: completed enterprise or divisional risk registers showing risks identified, assessed, and evaluated using the standard method.[2][1]
- Governance artefacts that show the process is embedded: terms of reference for risk committees, role descriptions for risk owners, and scheduled risk review cycles.[4][5]
- Training or awareness material showing that staff are informed about how to identify and escalate risks (e.g. presentations, intranet guidance, learning modules).[1][4]
Notes an assessor might make:
- “Risk management framework v2.1 approved by Board in May 2025; process aligned to ISO 31000 and applied across all business units.”[4]
- “Enterprise risk register evidences consistent use of standard likelihood/consequence matrix and risk criteria for all critical risks.”[2]
- “Quarterly risk committee pack includes standing agenda items on risk identification, assessment, and treatment planning.”[1][4]
E2 – Enabled
Evidence that treatments are defined, resourced, and linked to risk targets or tolerances, particularly for critical risks.[3][6][7]
You would expect to see:
- For each critical risk, defined treatment(s) or control improvements recorded in the risk register, including description, owner, due date, and implementation status.[2][1]
- Documented risk appetite and tolerance statements that set target risk levels (e.g. “no more than medium residual risk for safety incidents with potential fatality”).[6][3]
- Explicit linkage between each critical risk’s target level and the organisation’s risk appetite/tolerances (e.g. register fields or mapping that show “current residual” vs “target residual” aligned to appetite).[3][6]
- Evidence of resourcing for key treatments: budget approvals, project charters, assigned FTE, or contracts with external providers.[7][1]
- Key risk indicators (KRIs) or control indicators defined for each critical risk to monitor whether treatments are expected to keep exposure within tolerance.[8][5]
- Regular reporting that shows progress on treatment implementation for critical risks, including overdue items and escalation of slippage.[8][1]
Notes an assessor might make:
- “Risk appetite statement defines quantitative tolerances for WHS, cyber, and financial loss; risk register includes ‘target rating’ aligned to these tolerances for all critical risks.”[6][3]
- “For top 20 critical risks, specific treatment plans documented with named owners and funding approved through FY26 budget.”[7][1]
- “KRIs mapped to critical risks (e.g. number of high‑severity incidents, control test failures) and reported quarterly to Executive with thresholds linked to tolerance levels.”[5][8]
E3 – Executed
Evidence that treatments have demonstrably reduced risk exposure in practice, not just on paper.[9][10][8]
You would expect to see:
- Before/after risk ratings for critical risks showing movement from above‑tolerance to at‑or‑below‑tolerance following treatment implementation, with dates and rationale recorded.[6][2]
- Trend data for KRIs and incident metrics that show improvement attributable to treatments (e.g. sustained reduction in frequency or severity of relevant incidents, losses, or near misses).[9][8]
- Control effectiveness assessments or testing results indicating improved design or operation of key controls (e.g. internal audit reports, control testing, scenario exercises).[10][8]
- Post‑implementation reviews or benefits realisation reports for major risk treatments that specifically evaluate impact on risk exposure versus target.[9][1]
- Evidence that where treatment outcomes have not reduced risk to target, management has adjusted strategy, escalated exceptions, or reconsidered appetite.[3][6]
- Case examples where the organisation absorbed and recovered from an event more effectively due to new treatments (e.g. cyber incident response time reduced, service restored faster than prior events).[10][9]
Notes an assessor might make:
- “Residual ratings for 15 of 20 critical risks reduced from ‘High’ to ‘Medium’ over 12 months; narrative in register links reductions to implemented treatments and confirms alignment with risk appetite.”[6][2]
- “Lost‑time injury frequency rate and high‑potential near‑misses down >30% over two years following implementation of new safety controls; KRIs remain within tolerance thresholds.”[5][8]
- “Internal audit 2025–26 program reports improved control effectiveness for key cyber and financial controls; no critical control deficiencies remaining open for top risks.”[10][1]
Metric-specific evidence: “% of critical risks with treatments that reduce risk to target”
To support this specific metric, you would collate:
- A clearly defined list of “critical risks” and how they are designated (e.g. all inherent “Extreme/High” or risks above tolerance).[4][5]
- For each critical risk, documentation of current residual rating, target rating, and linkage to appetite/tolerance.[3][6]
- Data extract from the risk system showing, for all critical risks, whether there is at least one implemented or in‑progress treatment mapped, and whether current residual is at or below target.[8][1]
- Calculations of the metric (e.g. X of Y critical risks currently at or better than target with defined treatments), trended over time to show progress.[8][9]
- Commentary explaining any critical risks still above target, including planned treatments, timelines, and approved temporary appetite exceptions.[3][6]
An assessor’s working note might look like:
- “As at Q2 FY26, 24 of 30 critical risks (80%) have active treatments in place and residual ratings at or below target; remaining six have documented exceptions approved by Executive and time‑bound action plans.”[6][8]
Sources
[1] Risk Management 101: Process, Examples, Strategies https://auditboard.com/blog/risk-management-101
[2] [PDF] An Overview of the Risk Management Process https://www.finance.gov.au/sites/default/files/2019-11/Risk-Management-Process.pdf
[3] Understanding Risk Appetite and Tolerance https://www.finance.gov.au/sites/default/files/2020-03/Comcover%20Information%20Sheet%20-%20Understanding%20Risk%20Appetite.pdf
[4] Chapter 5: Risk Management Process – NSW Government https://www.nsw.gov.au/departments-and-agencies/nsw-treasury/documents-library/risk-management-toolkit/chapter-5-risk-management-process
[5] How key risk indicators help manage risk | vmia.vic.gov.au https://www.vmia.vic.gov.au/how-key-risk-indicators-help-manage-risk
[6] Linkage Between Risk Strategy, Appetite, Tolerances, and … https://www.casact.org/sites/default/files/presentation/caserm_2016_presentations_cs3.pdf
[7] Risk appetite essentials: Aligning strategy, goals, and … https://www.trustcloud.ai/risk-management/risk-appetite-essentials-aligning-strategy-goals-and-tolerance/
[8] Additional Resources | Department of Finance https://www.finance.gov.au/government/comcover/risk-services/management/risk-management-toolkit/additional-resources
[9] Parameterization Framework and Quantification Approach for Integrated Risk and Resilience Assessments https://pmc.ncbi.nlm.nih.gov/articles/PMC7821186/
[10] [PDF] Cyber Resiliency Metrics, Measures of Effectiveness, and … https://www.mitre.org/sites/default/files/2021-11/prs-18-2579-cyber-resiliency-metrics-measures-of-effectiveness-and-scoring.pdf
[11] Identify ISO 27001 Critical Risks Effectively | ISMS.online https://www.isms.online/iso-27001/risk-management/critical-risks/
[12] Key Risk Indicators (KRIs) in Enterprise Risk Management (ERM) AU https://www.protechtgroup.com/en-au/blog/key-risk-indicators-kris-in-enterprise-risk-management-erm
[13] [PDF] nbn Risk & Control Assessment Methodology | ACCC https://www.accc.gov.au/system/files/nbn-risk-control-assessment-methodology.pdf
[14] Design and assessment methodology for system resilience metrics https://www.ie.uh.edu/sites/ie/files/faculty/glim/Risk%20Analysis%20(DRAFT).pdf
[15] 6 Practical Examples of Risk Management in Action – Pirani https://www.piranirisk.com/blog/6-practical-examples-of-risk-management-in-action